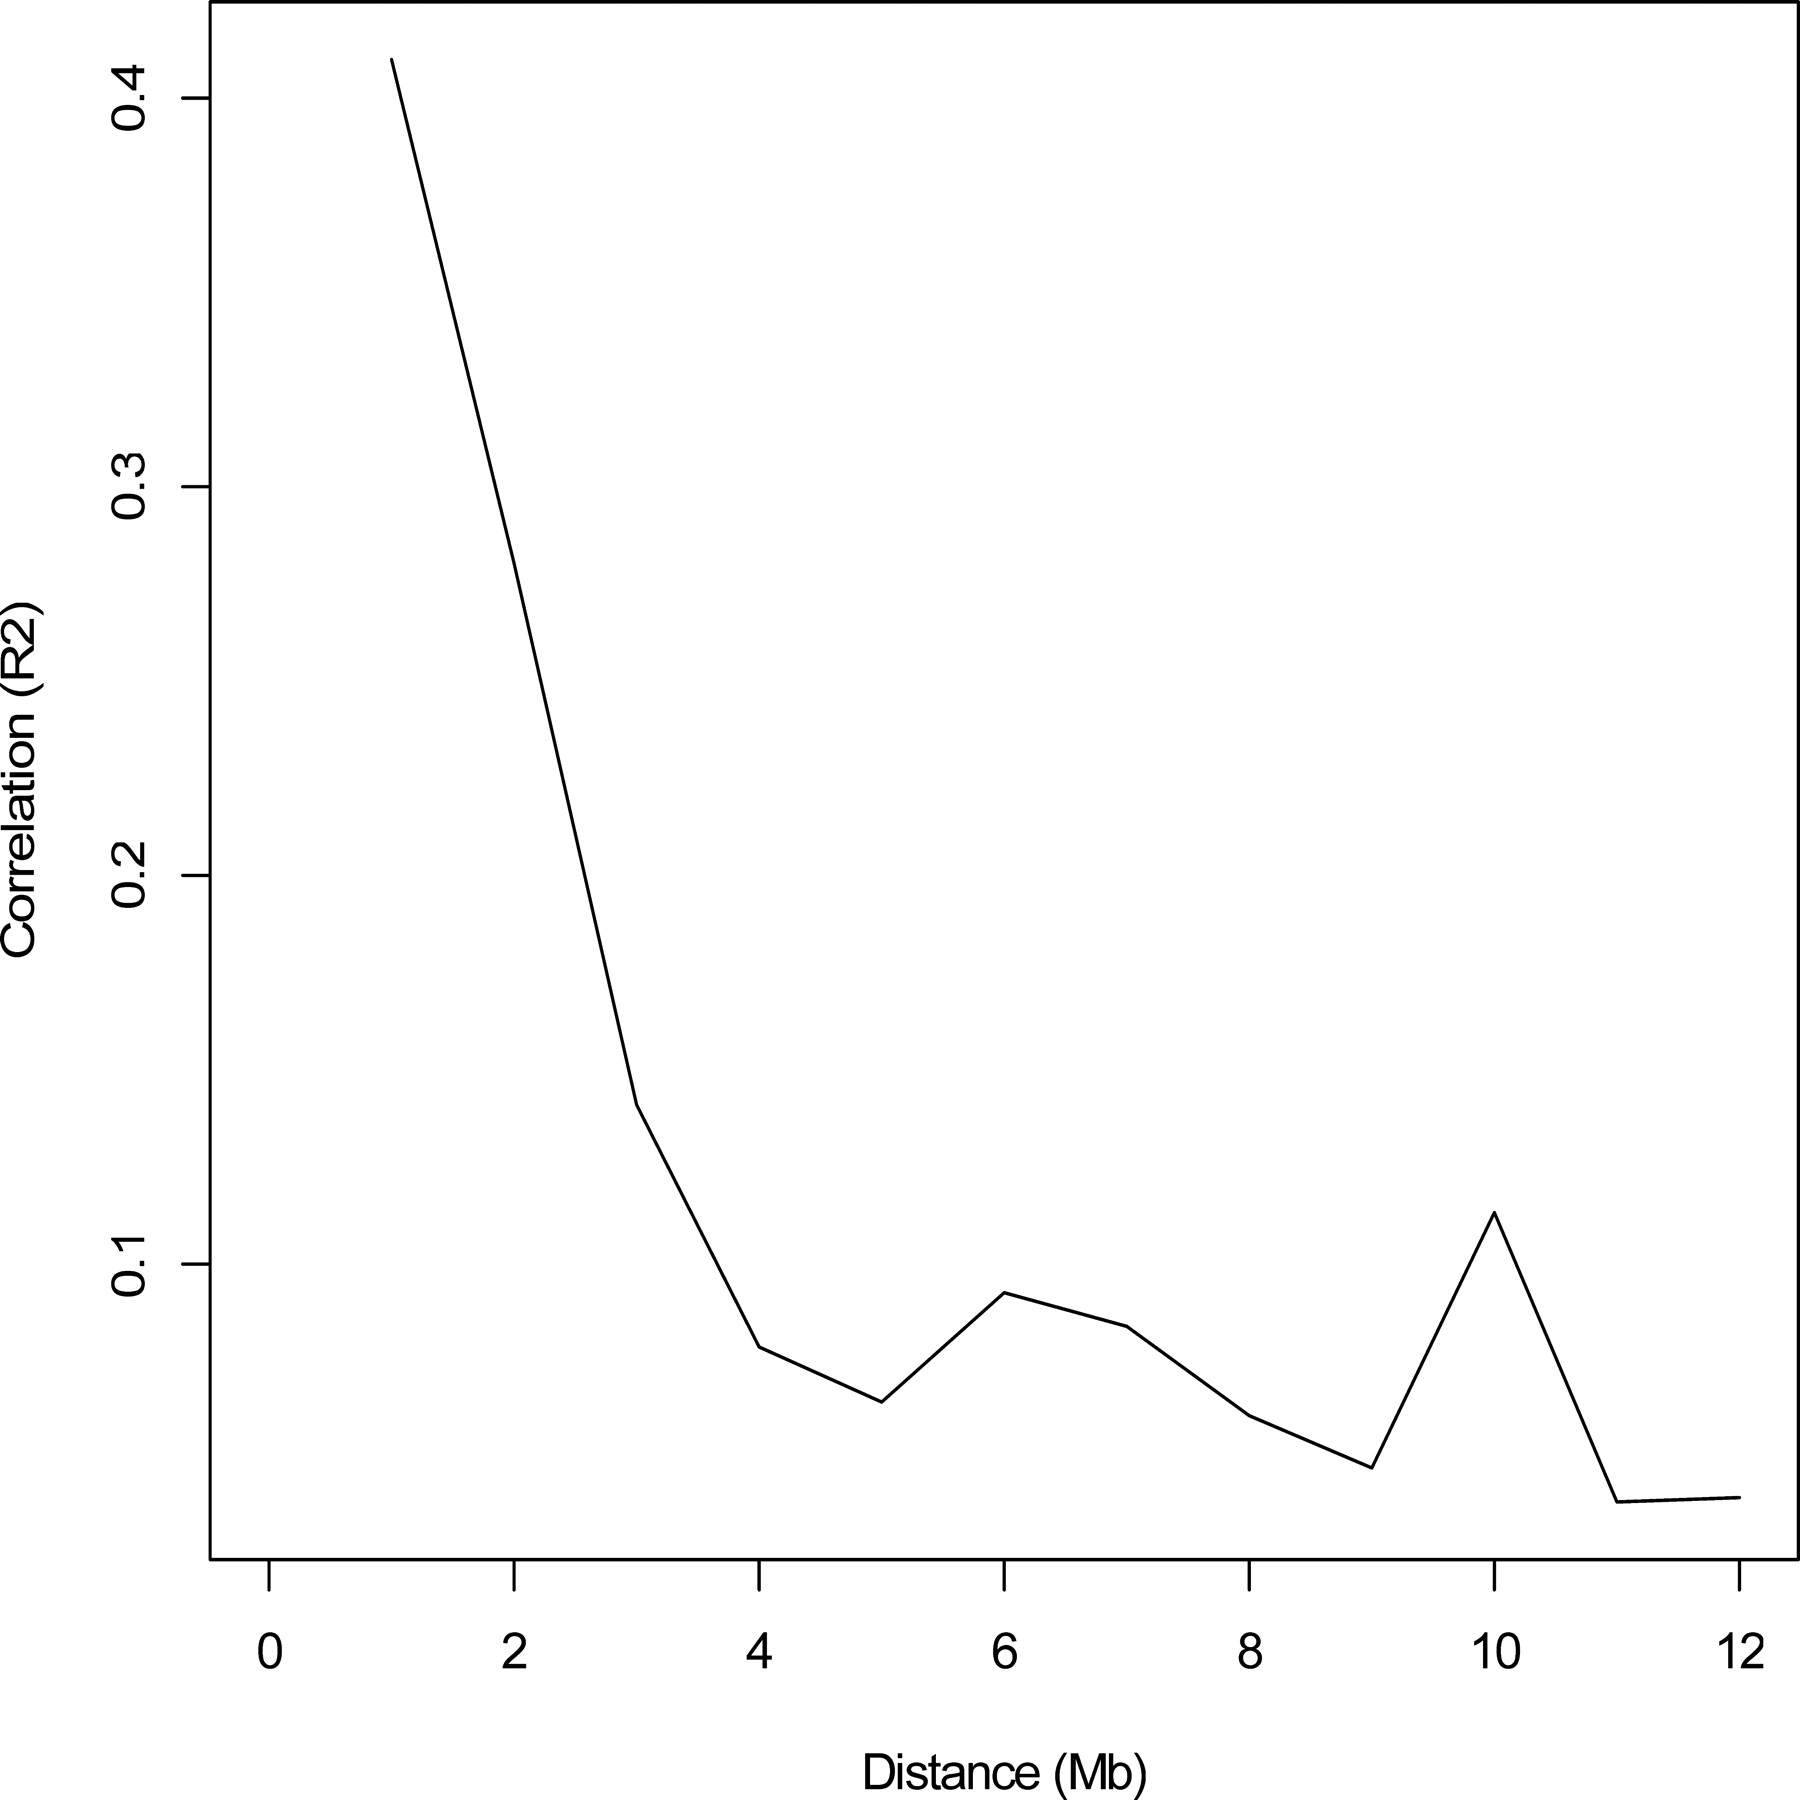
A resource for the simultaneous high-resolution mapping of multiple quantitative trait loci in rats: The NIH heterogeneous stock

(Downloading may take up to 30 seconds. If the slide opens in your browser, select File -> Save As to save it.)

Click on image to view larger version.

Figure 1.
Figure 1.

Linkage disequilibrium decay in the NIH-HS rats. The figure plots the decay in mean r2 (R2) on the vertical axis with distance (megabases) on the horizontal axis. The data are from 110 SNP markers on chromosomes 5 and 15.

This Article

  1. Genome Res. 19: 150-158

Preprint Server