
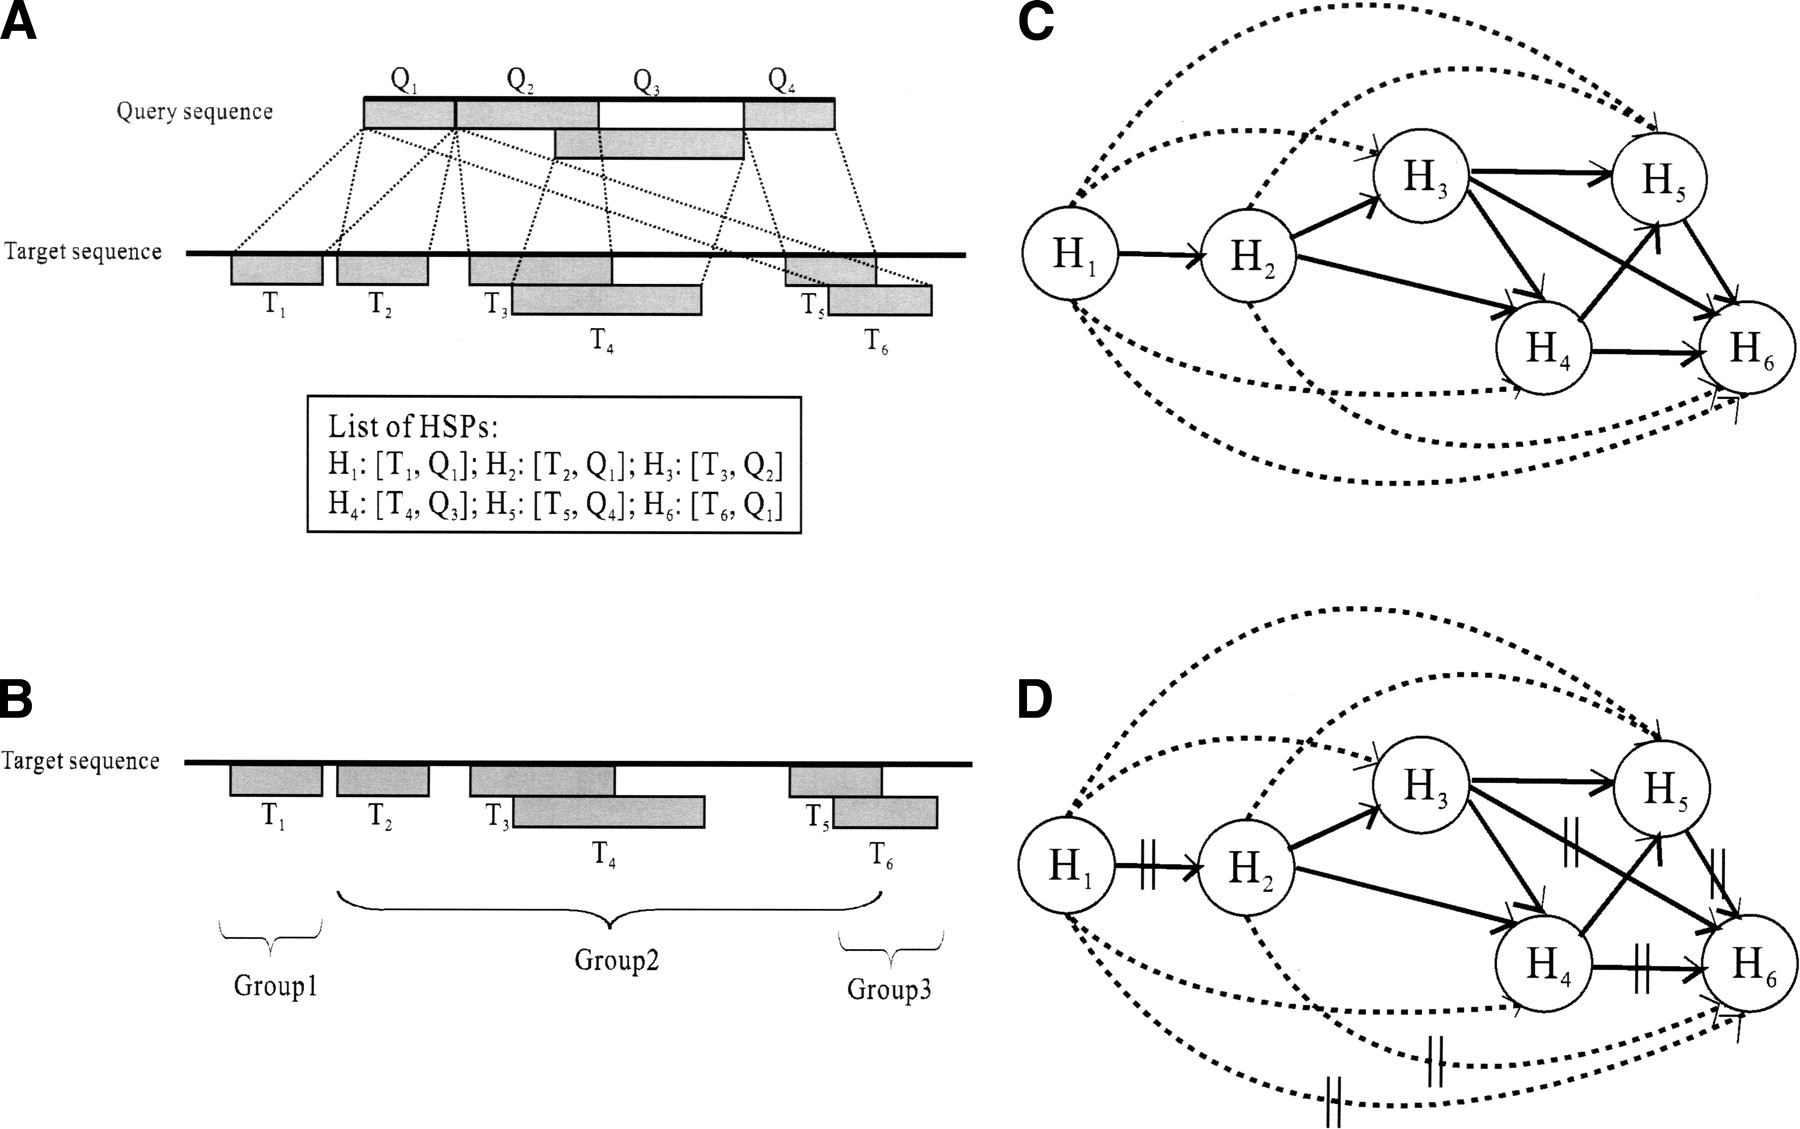
Figure 5.
(A) HSPs returned by BLAST. Q1, Q2, Q3, and Q4 represent query segments, while T1, T2, T3, T4, T5, and T6 represent target segments. (B) Example of groups of HSPs. (C) The HSP graph, with solid lines representing edges and dotted edges indicating skip edges. (D) The HSP graph, with vertical bars indicating separating edges.


