
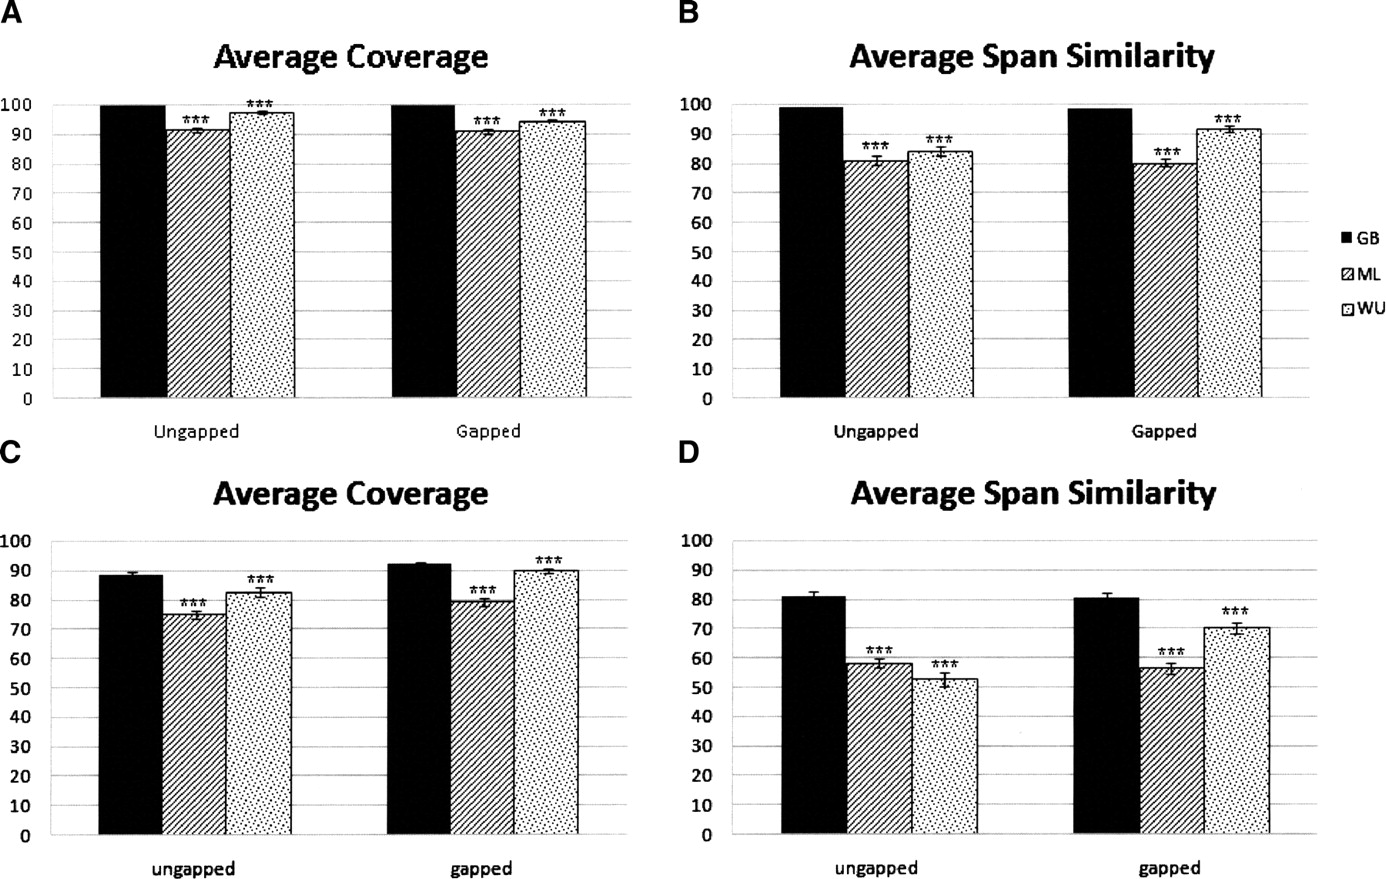
Figure 4.
(A) Average coverage for EvsE data set. (B) Average span similarity for EvsE data set. (C) Average coverage for EvsB data set. (D) Average span similarity for EvsB data set. In all cases, figures represent averaged results over 464 test genes for three different programs genBlastA (GB), Cui et al. (2007) (ML), and WU-Blast (WU). Gapped and ungapped represent two independent BLAST results using either gapped setting or ungapped setting. Span similarity is calculated by Jaccard similarity. GB alpha value is 0.5. ML distance threshold is 1000. Error bars, SE. (***) Statistical significance (P < 0.001) by paired Student’s t-test.


