
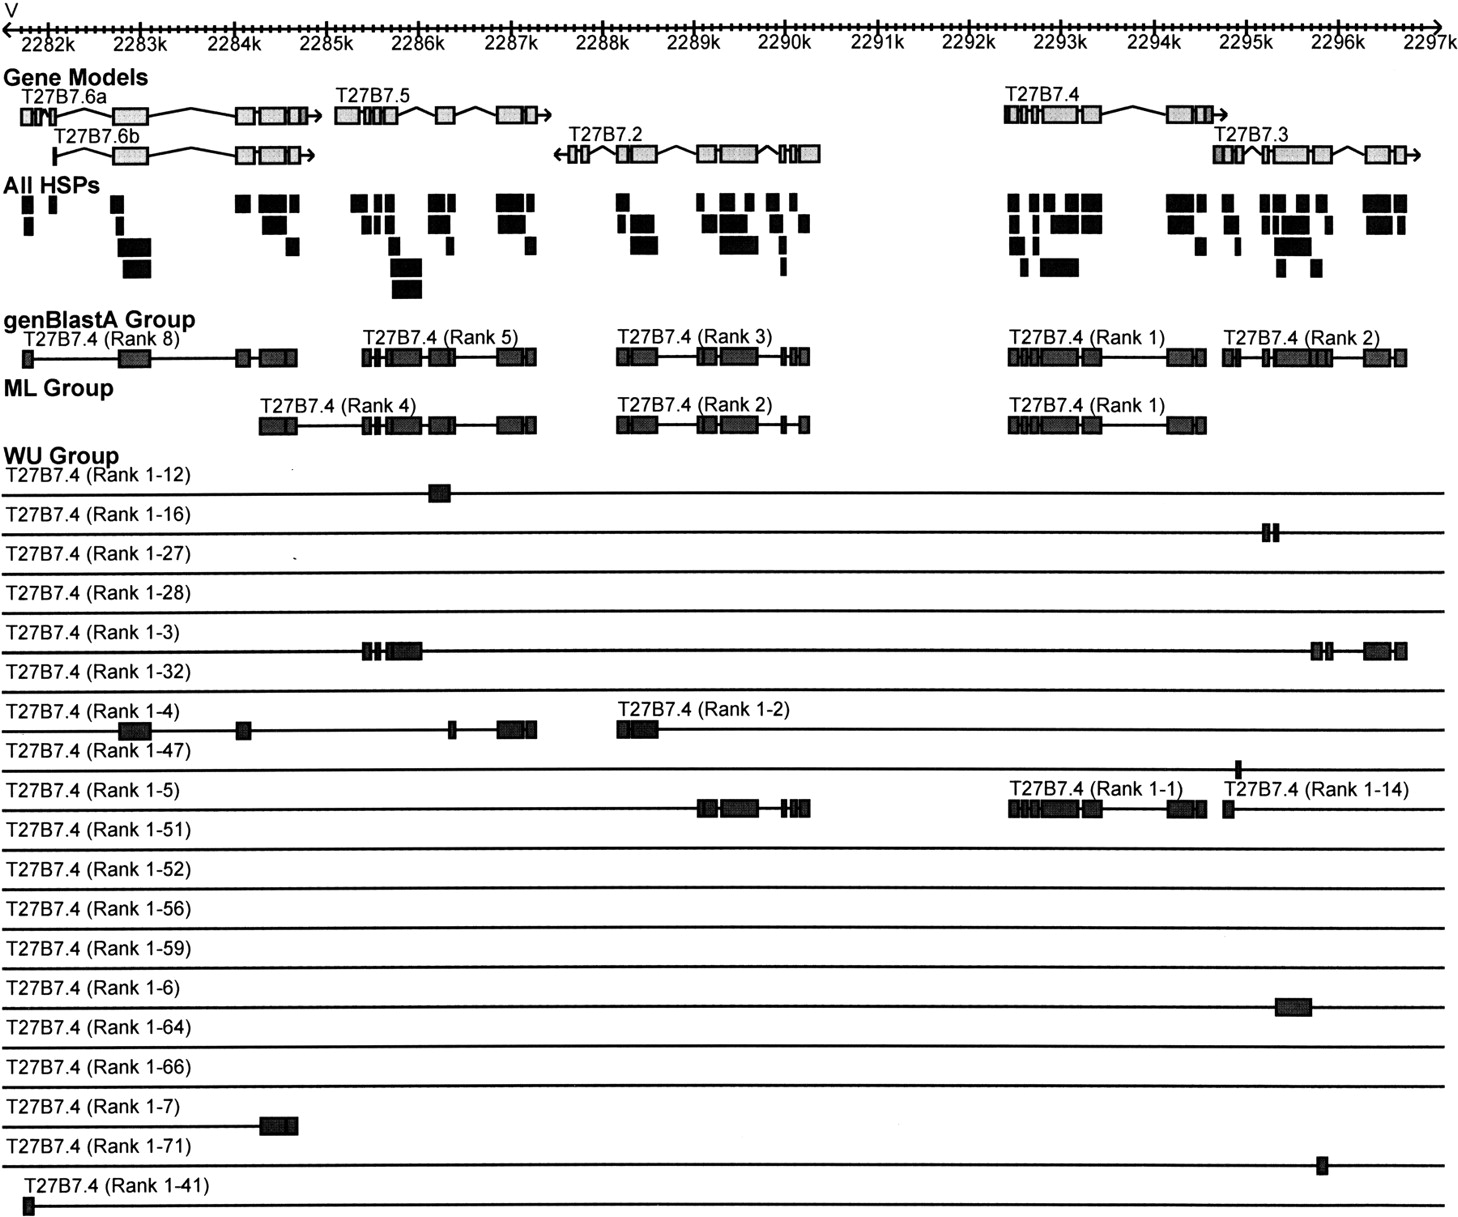
Figure 2.
Grouping HSPs into groups representing individual genes. genBlastA was able to resolve all five members, while ML resolved only two and WU only one. Gene models are shown in the Gene Models track. HSPs are shown as blue boxes in the All HSPs track. The color indicates different PIDs for the HSPs. Darker color indicates higher PID. The genBlastA Group, ML Group, and WU Group tracks show HSPs groupings that are returned by genBlastA, ML, and WU-BLAST, respectively.


