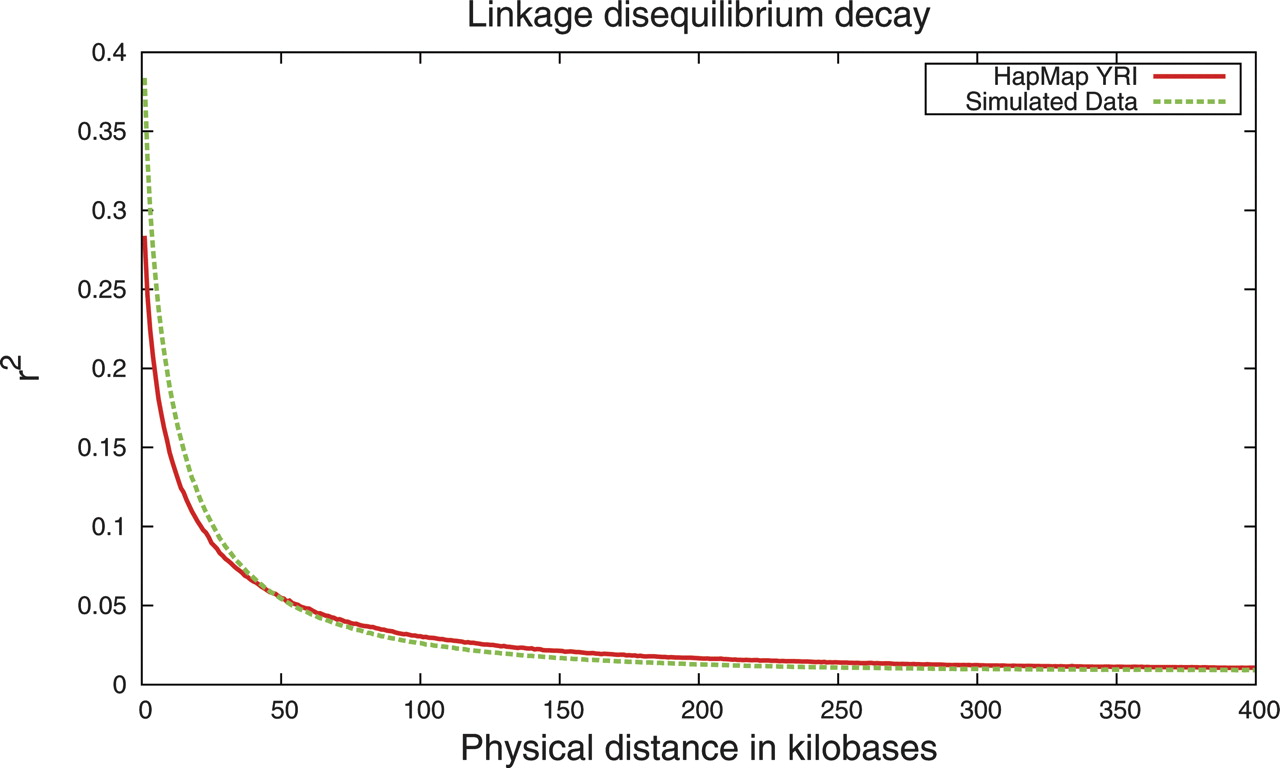
Fast and flexible simulation of DNA sequence data

(Downloading may take up to 30 seconds. If the slide opens in your browser, select File -> Save As to save it.)

Click on image to view larger version.

Figure 1.
Figure 1.

Average r2 values were computed across all pairs of nearby (maximum 1 Mb) SNPs for a 270-Mb region. Values for simulated data and HapMap YRI (Chromosome 1) are indicated by the green and red lines, respectively.

This Article

  1. Genome Res. 19: 136-142

Preprint Server