
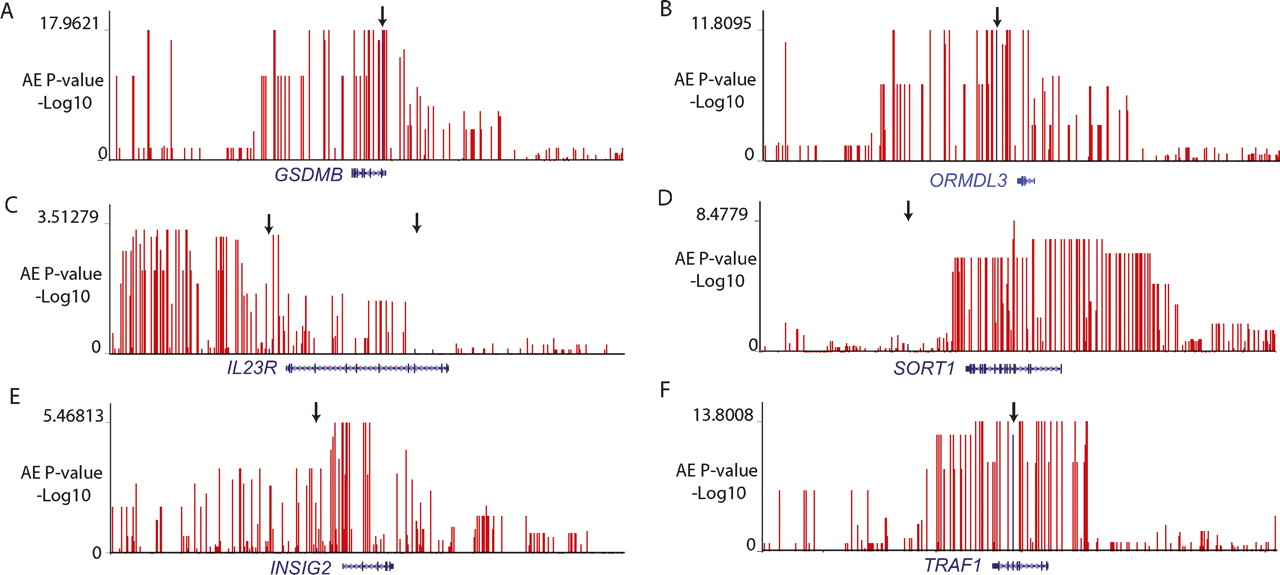
Figure 2.
Allelic imbalance association mapping results for GWAS genes. Vertical red lines correspond to –log10(P-value) of the AE assay for each SNP tested. The arrow points to the GWAS SNPs, indicated by the vertical blue lines. (A) GSDMB (asthma); (B) ORMDL3 (asthma); (C) IL23R (Crohn’s disease); (D) SORT1 (Dyslipidemia); (E) INSIG2 (Obesity); (F) TRAF1 (Rheumatoid arthritis).


