
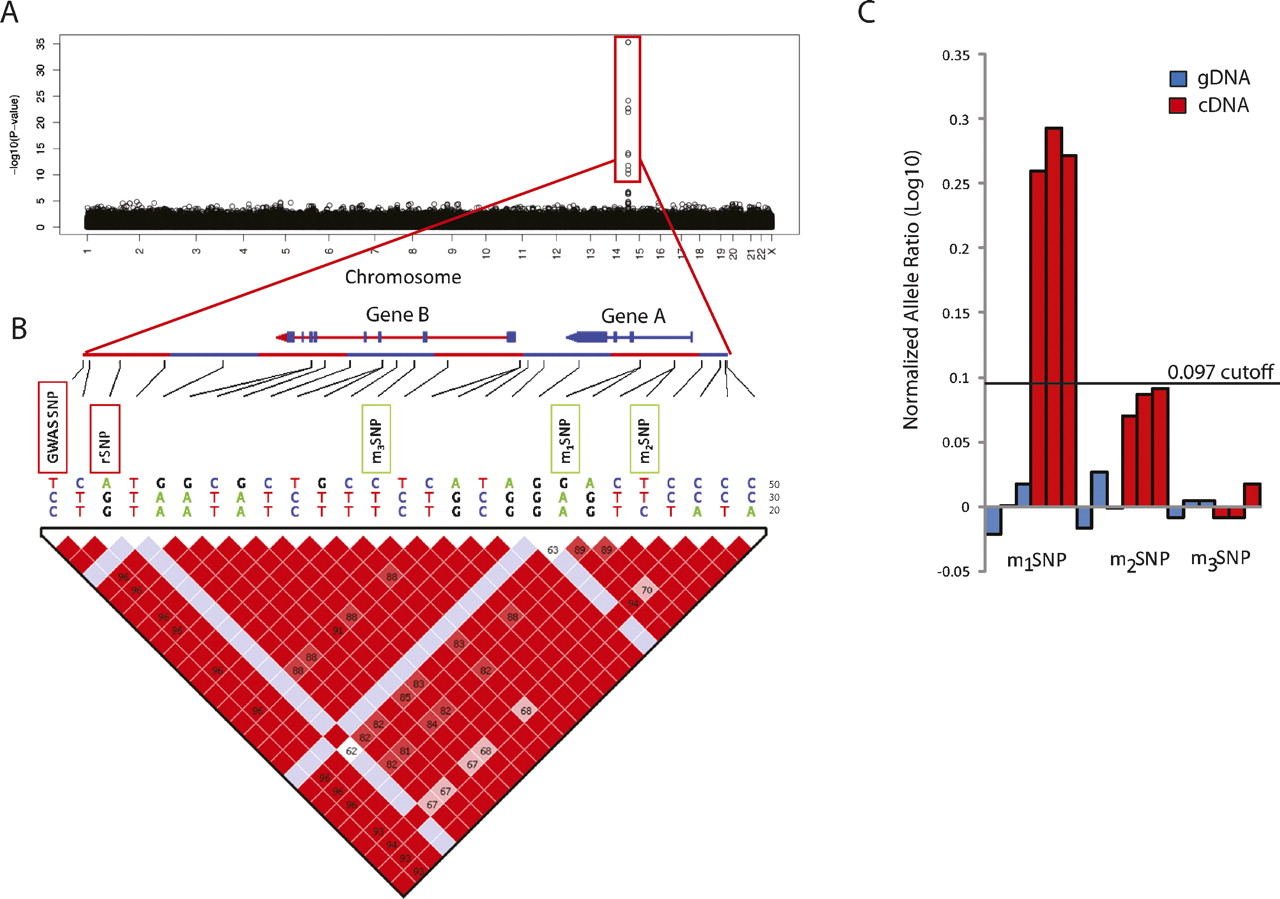
(A) Hypothetical Manhattan plot for a disease GWAS, demonstrating a strong association to SNPs on chromosome 14, highlighted in red block. (B) Genomic region demonstrating an LD block spanning the GWAS SNPs. Marker SNPs (m1SNP, m2SNP, m3SNP) in genes (A and B), found in strong LD with the GWAS SNP, are used to assay for AE (rSNP, regulatory SNP). (C) Normalized allele ratio (log10) graph demonstrating different scenarios. Strong allelic expression is found for Gene A using m1SNP that tests for the same haplotypes found for the GWAS SNP. Marker m2SNP shows borderline AE for the same gene (Gene A) and tests for a different pattern of haplotypes. No AE is found for Gene B using m3SNP as the gDNA, and cDNA ratios are not significantly different from each other.


