
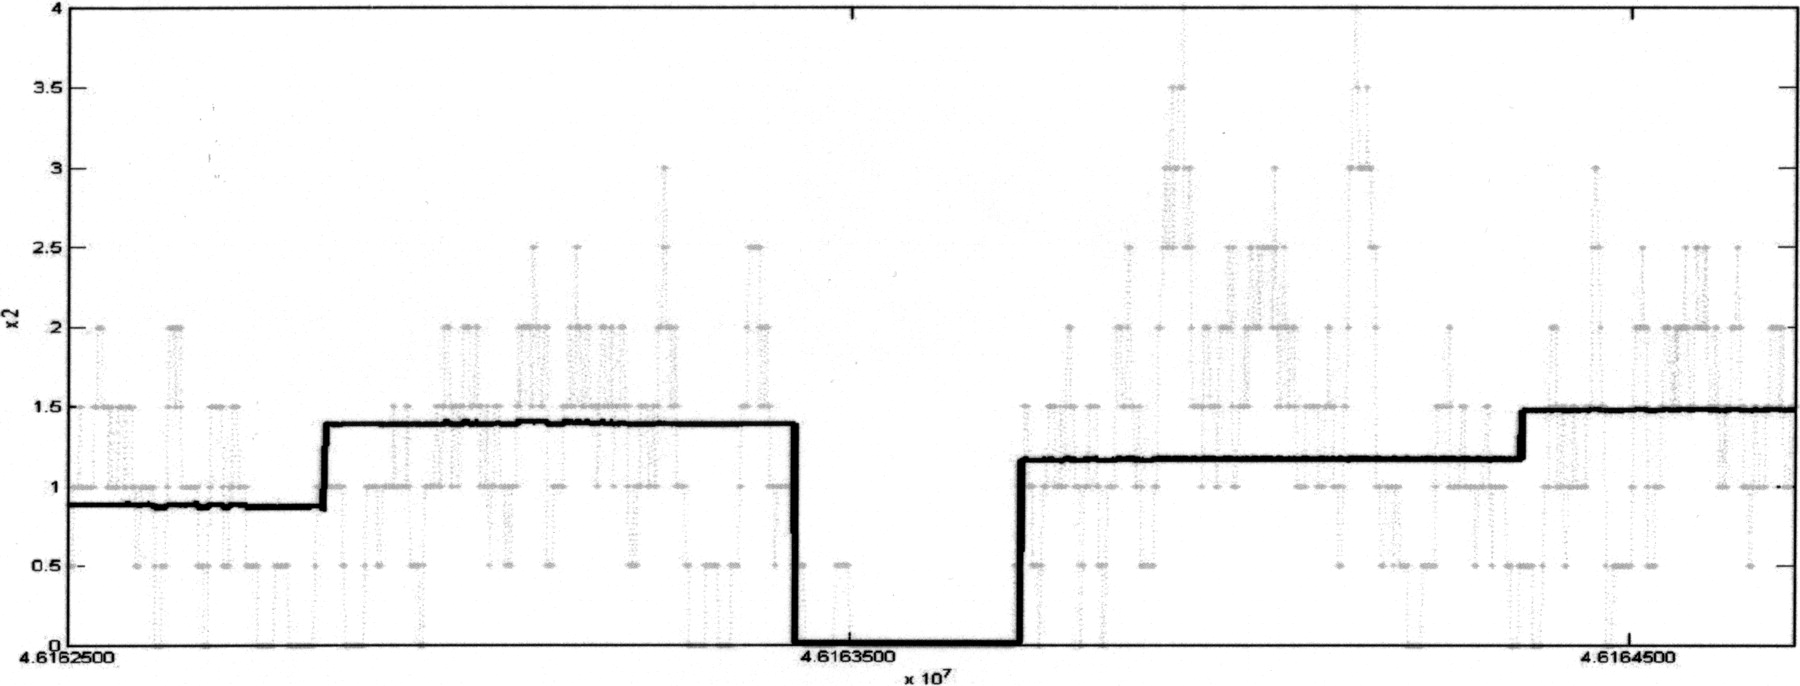
Figure 7.
Proof-of-concept application of MSB to Illumina CD signal on a part of chromosome 21. The data is from position 46,162,500–46,164,711 on the x-axis. The y-axis shows the half representation of frequencies (actual frequencies are multiplying the numbers by 2). Light color shows the experimental results. MSB identified several regions of changed copy number, shown in black lines.


