
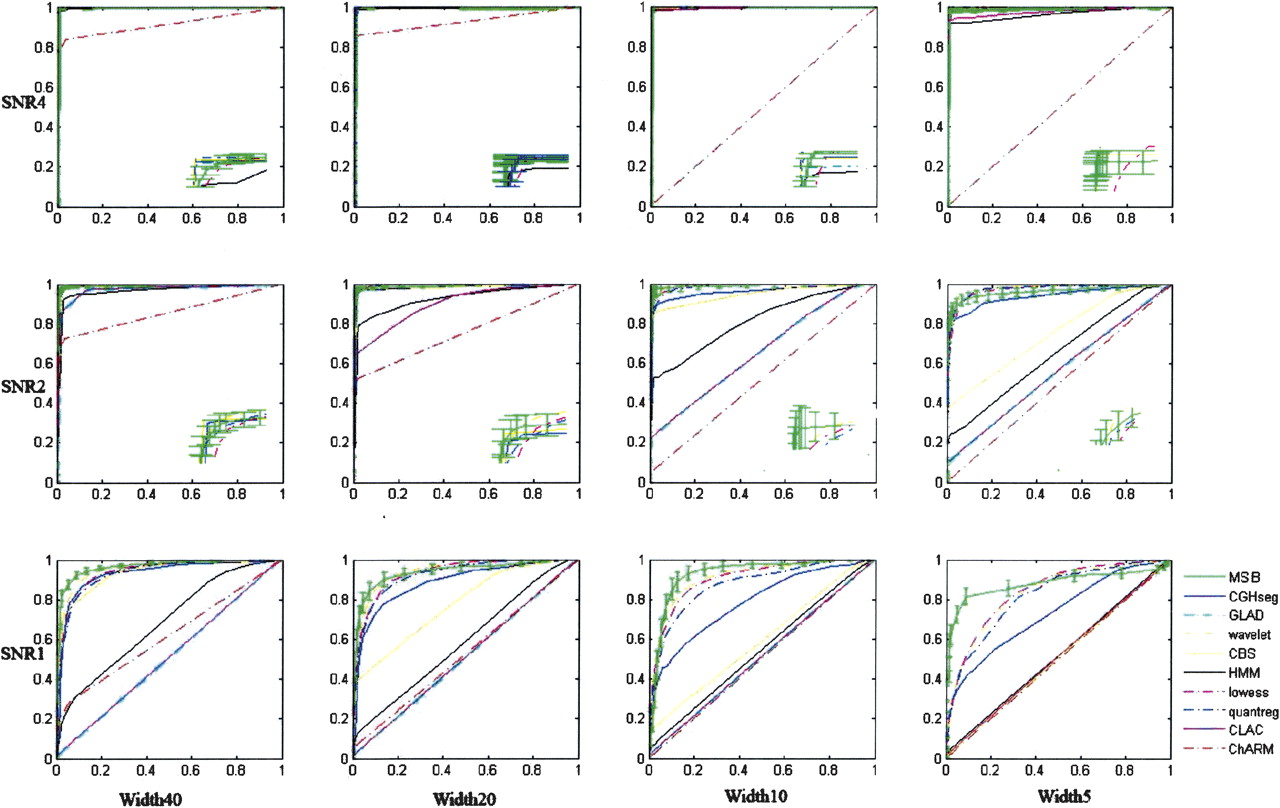
Receiver operating characteristic (ROC) analysis for array-CGH algorithms on simulation data sets. These data sets were simulated at different aberration widths and signal-to-noise ratios (SNRs). Each row represents three different SNR levels (4, 2, and 1, from top to bottom, respectively), and the columns represent aberration widths of 40, 20, 10, and 5 probes from left to right, respectively. The x-axis is 1 − specificity (the false positive rate) and the y-axis is the sensitivity (true positive rate). The curves were generated by measuring the sensitivity and specificity on simulated data at different threshold levels. The green curve refers to MSB. Its 90% confidence intervals are shown by the green bars for different levels. The blue curve is for CGHseg (Picard et al. 2005); the cyan point curve for GLAD (Hupe et al. 2004); the yellow dot curve for wavelet (Hsu et al. 2005); the solid yellow curve is for CBS (Olshen and Venkatraman 2002, 2004; Hsu et al. 2005); the magenta dot curve is for lowess (Beheshti et al. 2003); the blue dot curve is for quantreg (Eilers and de Menezes 2005); the red dot curve is for ChARM (Myers et al. 2004; Lai et al. 2005), the solid black curve is for HMM (Fridlyand et al. 2004); and the solid purple curve is for CLAC (Wang et al. 2005). The bottom right of each figure at SNR level 4 and 2 shows the zoom-in at the low false positive rate region.


