
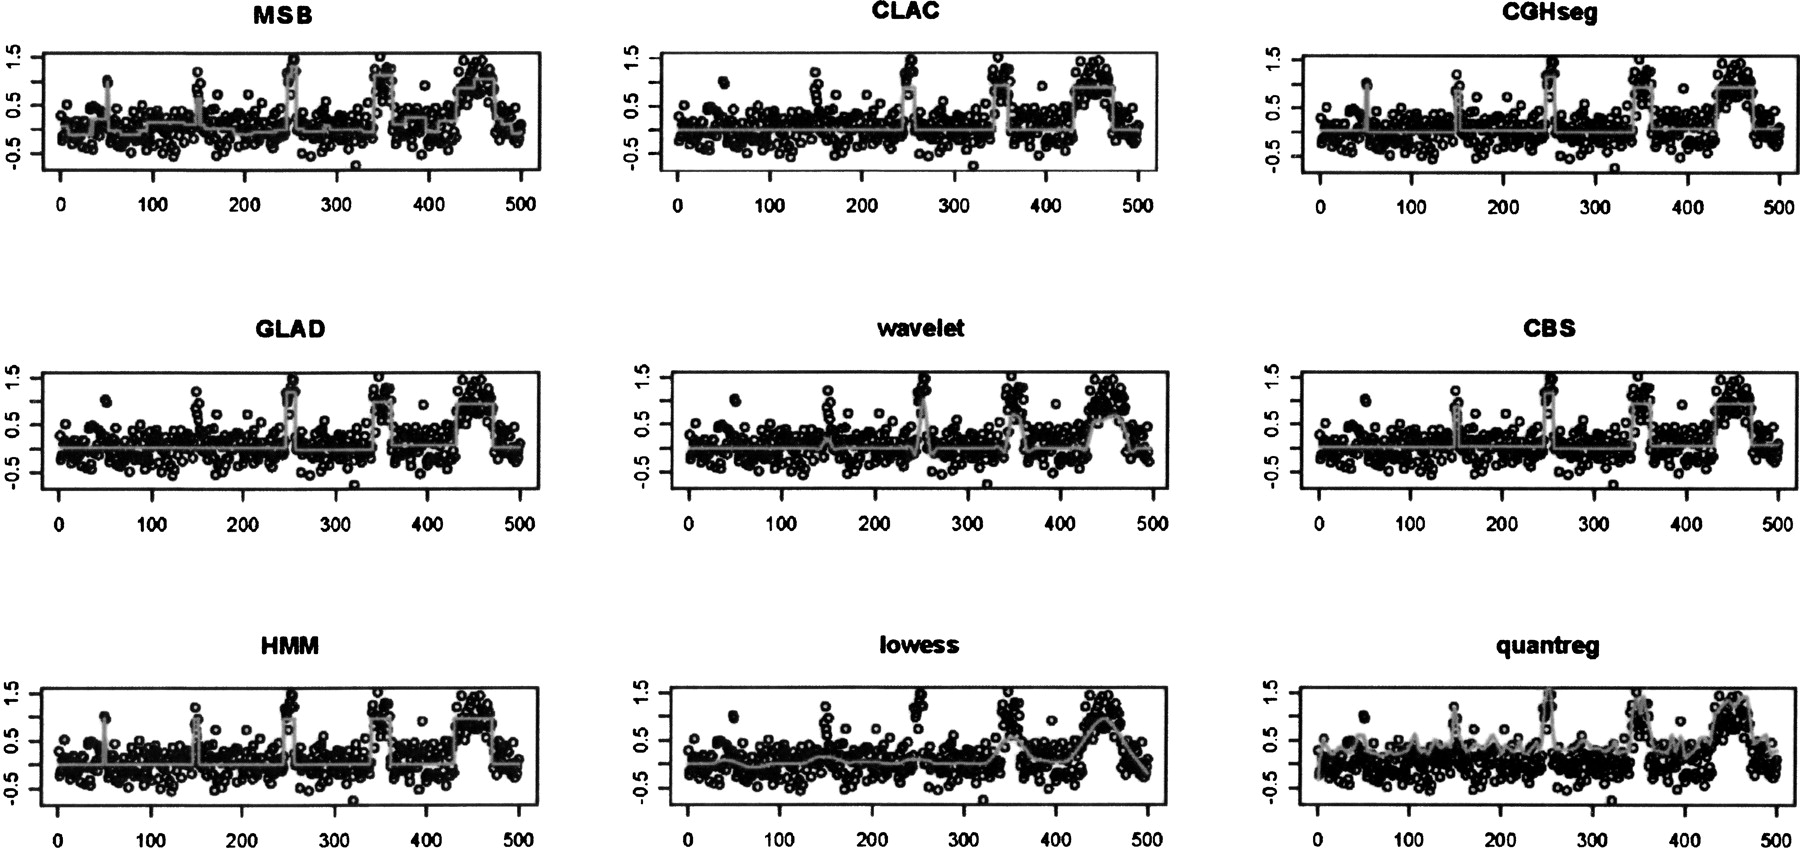
Figure 2.
An example of simulated array-CGH data by composed aberrations with increasing width (2, 5, 10, 20, and 40 probes). This signal profile consists of five aberrations of width in increasing order. The amplitude of aberration is 1. Gaussian noise with σ = 0.25 was imposed onto the signal profile in the simulated data. MSB, CGHseg, and HMM clearly detected all five aberrations.


