
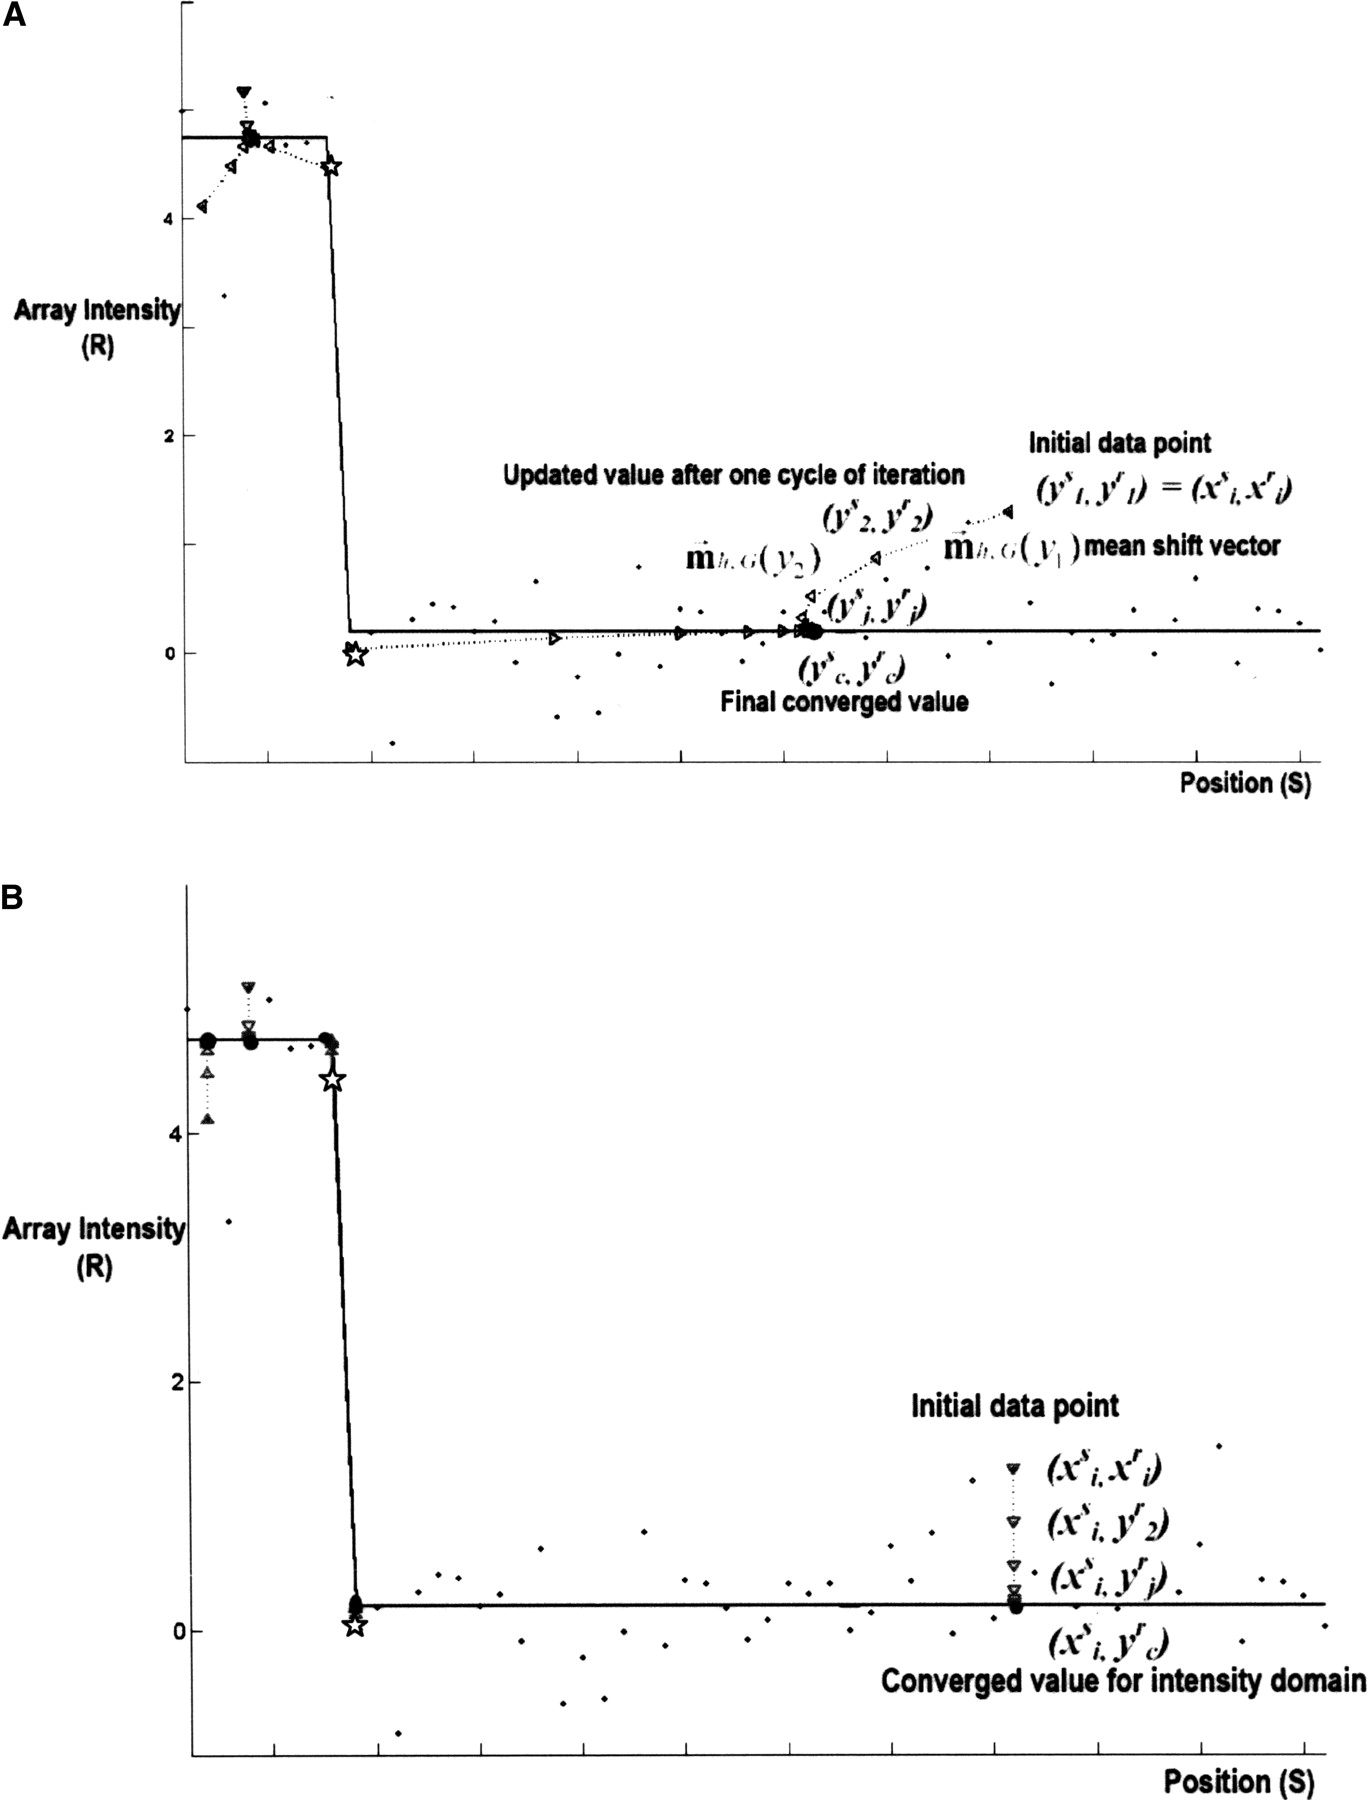
Mean-shift mode finding: A simple example of an array-CGH data segment from glioblastoma sample. (A) Mean-shift process: The successive set of triangles shows the yj, more particularly ( ,
,  ), in the mean-shift iterations, while their connecting dashed lines show the mean-shift vector. (B) Mean-shift smoothing in the intensity domain: The successive set of triangles shows (
 ,
,  ), where
  refers to the spatial location, and
  refers to the intensity domain. The value zi = (
 ,
,  ) after convergence is the filtered data point. Here, we visualize only 59 points for the purpose of illustration. The data
represent a small segment of chromosome 7 of the GBM29 sample. The data consist of 67 probes among the nucleotide positions
ranging from 54,908,778–64,080,642 on chromosome 7 of GBM29. The points represent the actual measurements of the CGH experiments
along the chromosome segment. The straight lines show the results of MSB. The sets of successive locations shown by triangles
converge to the local modes of the intensity domain. The last one of these successive locations is the point of convergence
for each set. The eight points on the left side are attracted by the mode at the amplitude of 4.75 in the intensity domain, while the 51 points on the right are attracted by the mode at the amplitude of 0.2 in the intensity domain. Clearly, the eighth and ninth points (shown with
stars) are attracted by different modes separately.
) after convergence is the filtered data point. Here, we visualize only 59 points for the purpose of illustration. The data
represent a small segment of chromosome 7 of the GBM29 sample. The data consist of 67 probes among the nucleotide positions
ranging from 54,908,778–64,080,642 on chromosome 7 of GBM29. The points represent the actual measurements of the CGH experiments
along the chromosome segment. The straight lines show the results of MSB. The sets of successive locations shown by triangles
converge to the local modes of the intensity domain. The last one of these successive locations is the point of convergence
for each set. The eight points on the left side are attracted by the mode at the amplitude of 4.75 in the intensity domain, while the 51 points on the right are attracted by the mode at the amplitude of 0.2 in the intensity domain. Clearly, the eighth and ninth points (shown with
stars) are attracted by different modes separately.


