
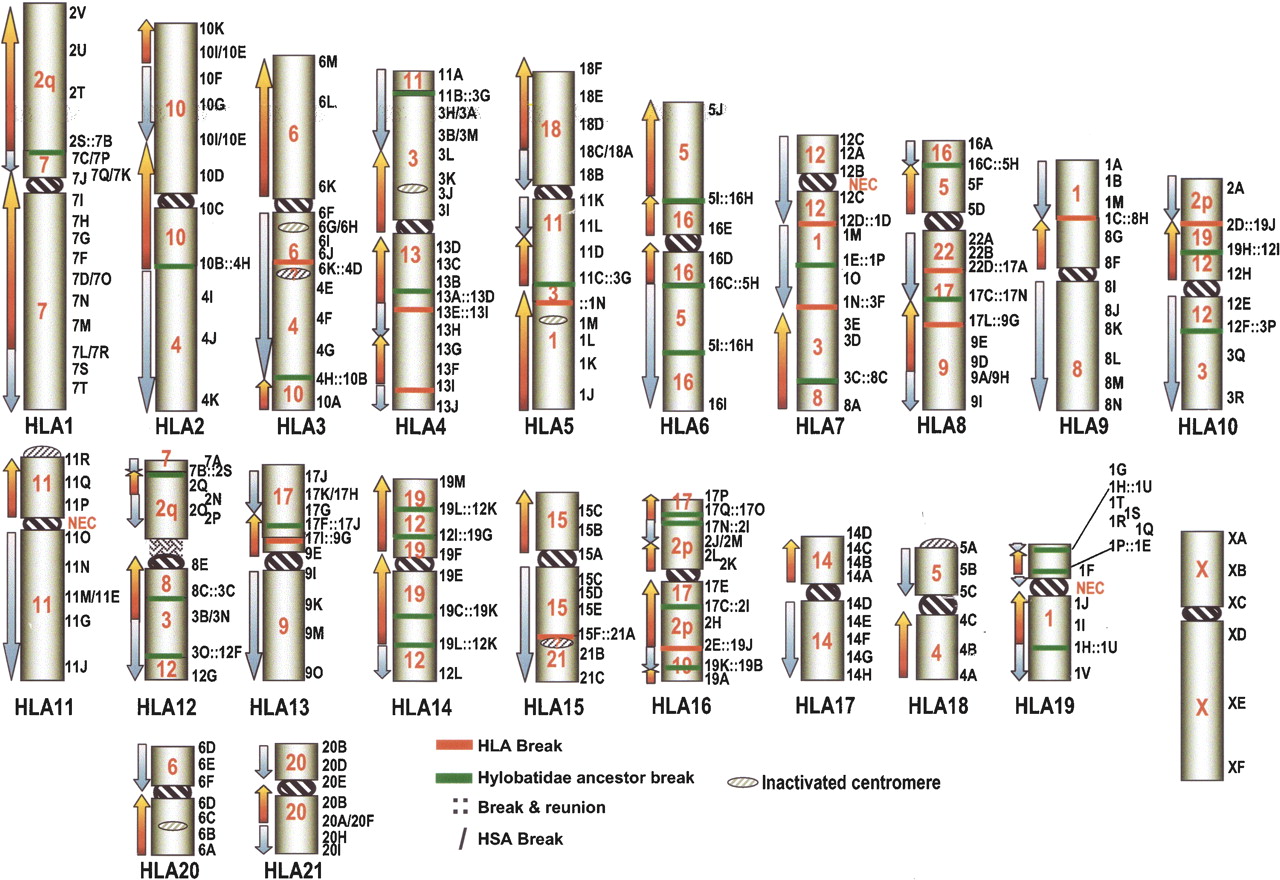
HLA ideogram showing the synteny block correspondence with the human genome. Internal red numbers indicate the human corresponding chromosome. Blue and red arrows indicate concordant (blue) and inverse (red) sequence polarity (orientation) with respect to humans. Black numbers (chromosome) followed by a letter (BAC), on the right, indicate specific BACs as reported in the Supplemental Table S1. Breakpoints in HLA are indicated by red bars (as in Supplemental Table S2). Breaks that occurred in HyA are represented by green bars (see Supplemental Table S1). (∷) Breakage and reunion in HLA and/or HyA, and the most proximal clones are reported. Rearrangements in HSA generate apparent breaks in HLA. These apparent breaks are indicated as clones facing each other (3M/3D, for example).


