
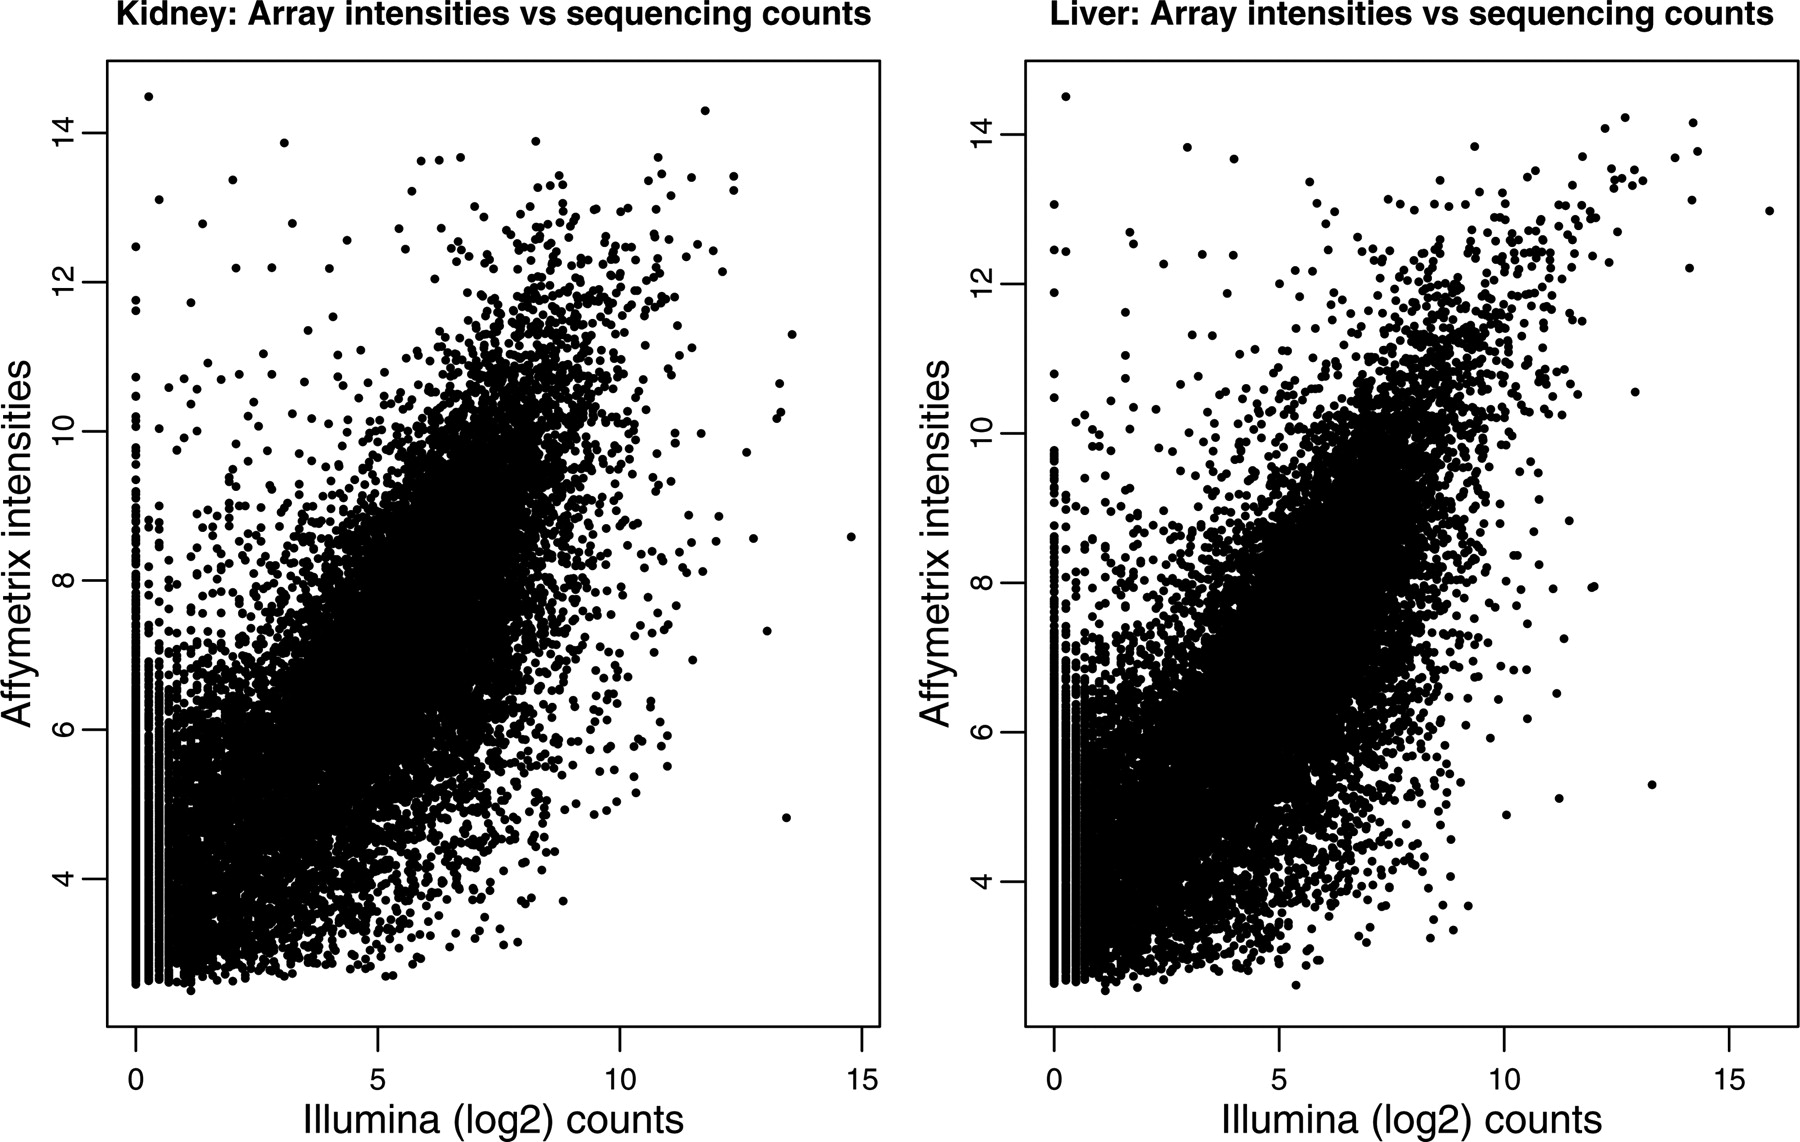
Figure 3.
Comparing counts from Illumina sequencing with normalized intensities from the array, for kidney (left) and liver (right). In each panel, the average (log2) counts for each gene are plotted on the X-axis, and the corresponding normalized intensities from the array are shown on the Y-axis. To avoid taking the log of 0, we added 1 to each of the average counts prior to taking logs.


