
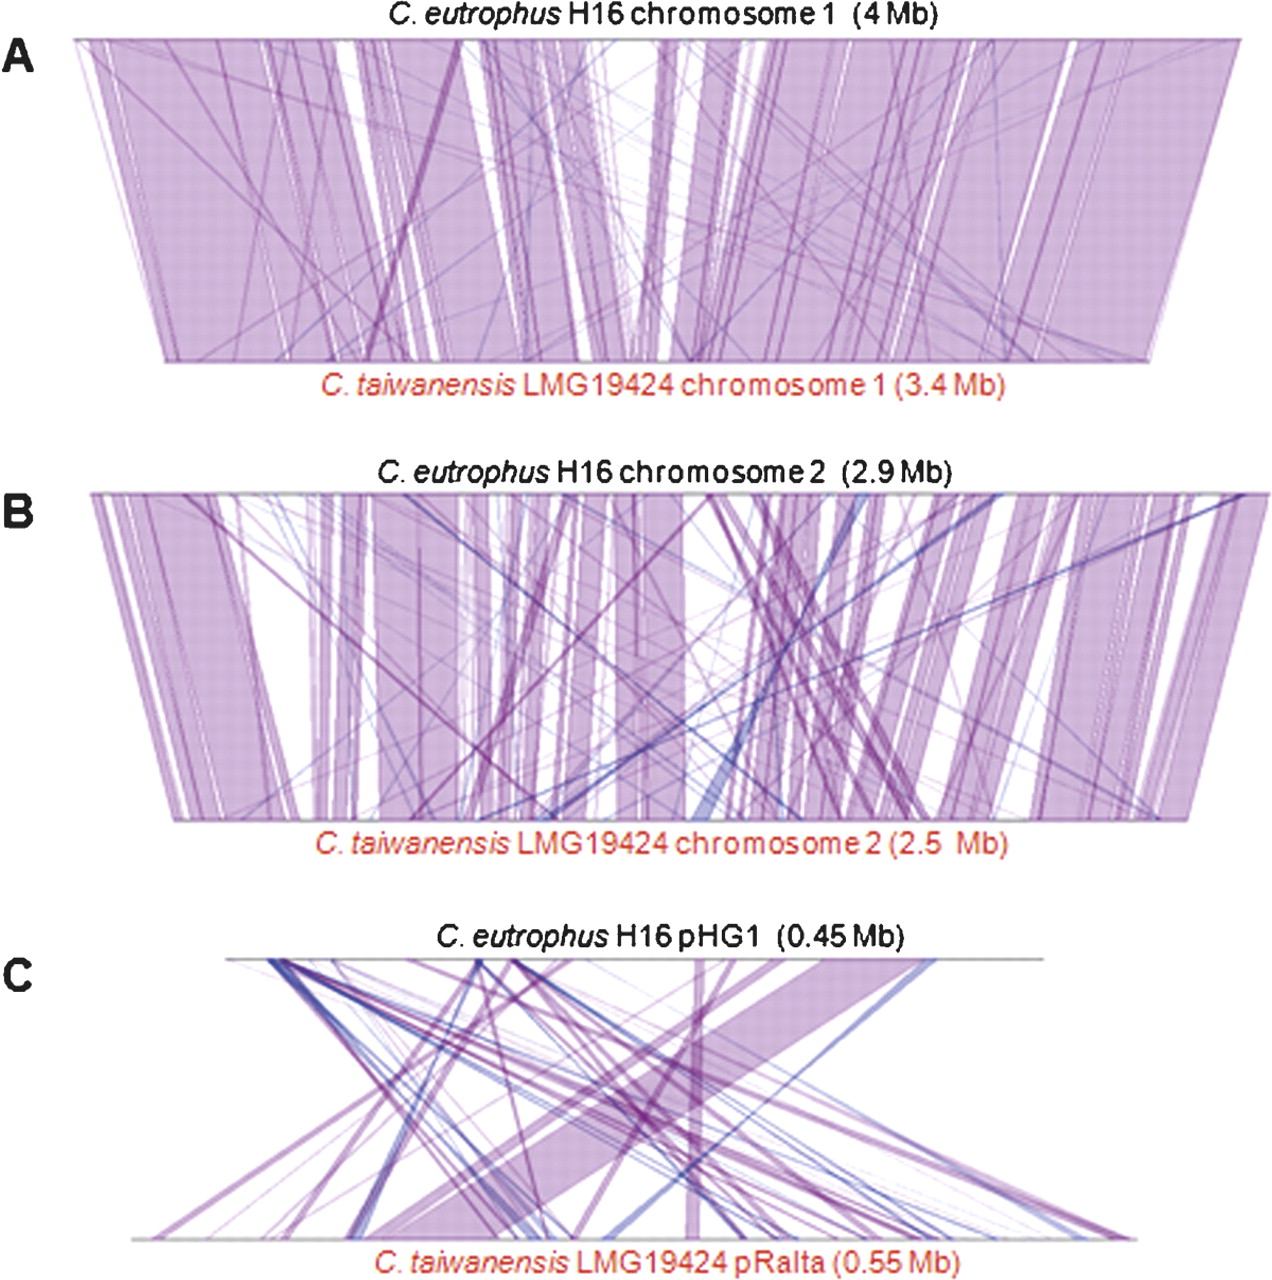
Figure 2.
Synteny plots between the C. taiwanensis and C. eutrophus genomes. Conserved gene clusters, i.e., synteny groups, were computed according to Vallenet et al. (2006). Synteny groups containing a minimum of five (A,B) or three (C) genes are shown for colinear regions (purple), and for inverted regions (blue). The display has been obtained using the MaGe graphical interface of the CupriaviduScope project (https://www.genoscope.cns.fr/agc/mage).


