
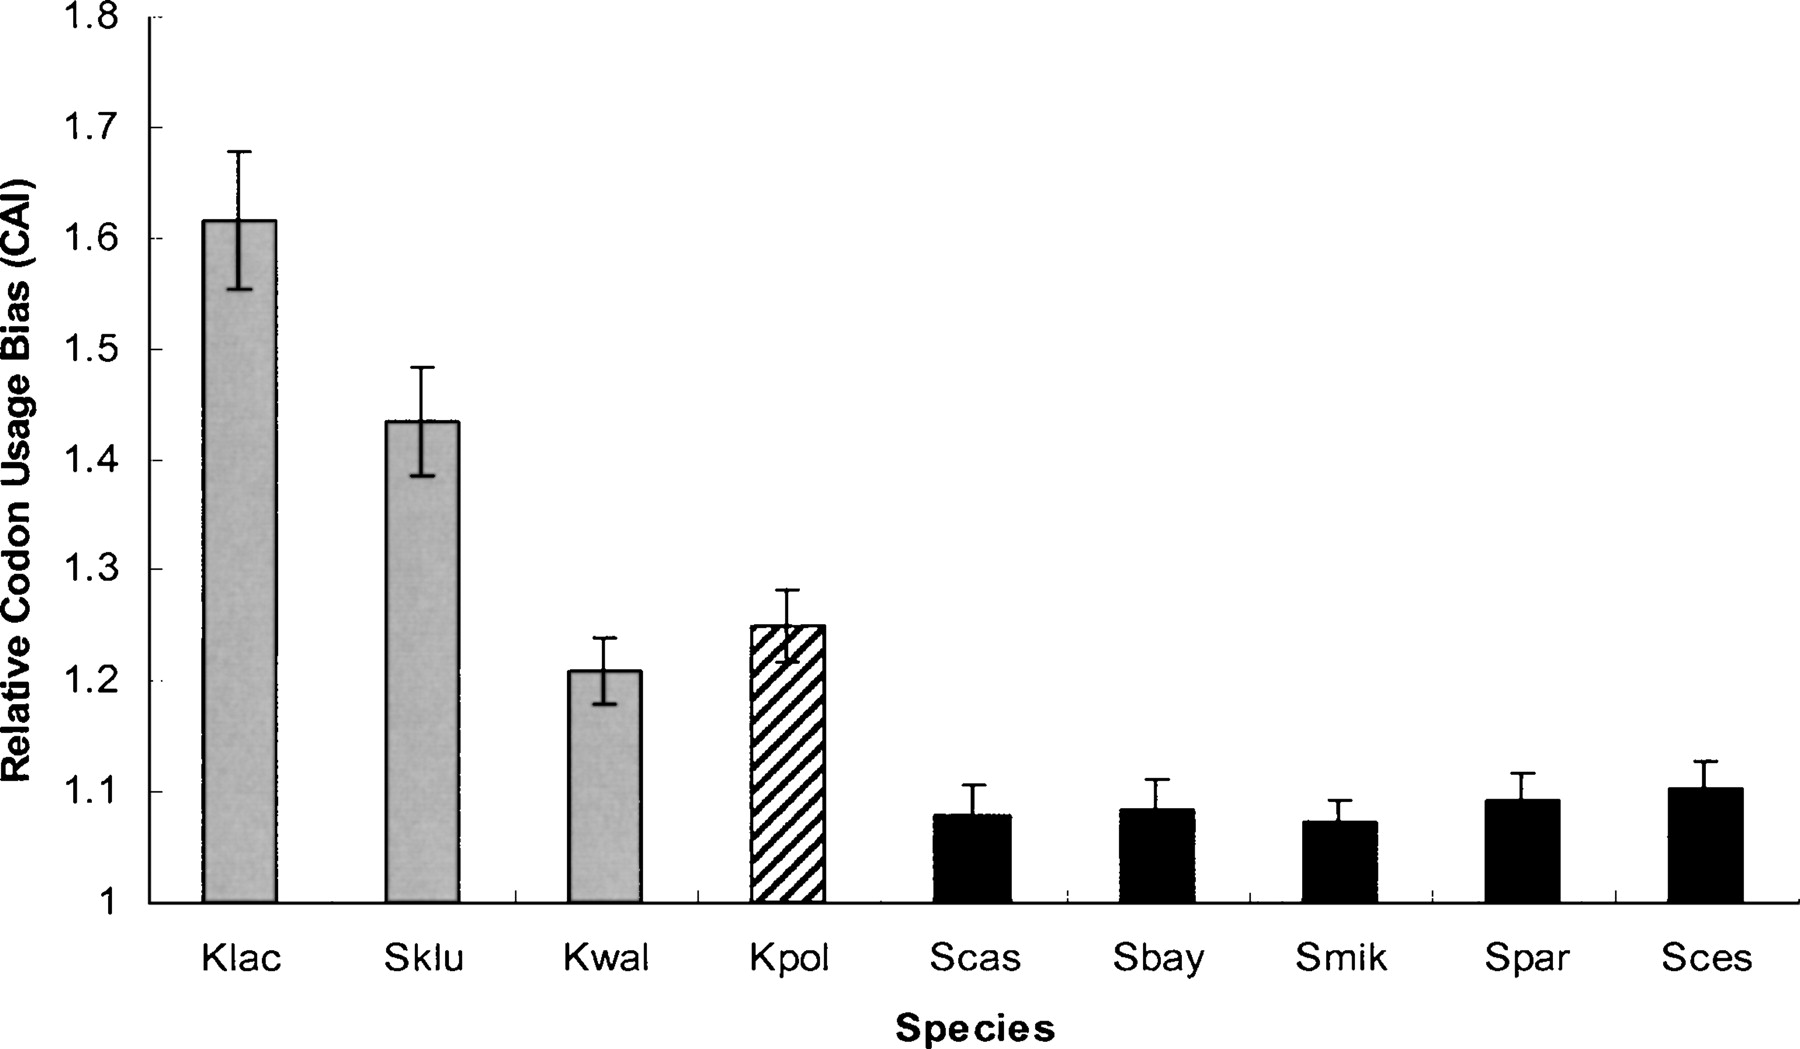
Figure 2.
Average codon usage bias for mitochondrial genes in each species. The means and standard errors were calculated from the normalized CAI values. (Shaded bars) Three pre-WGD species; (black bars) the post-WGD species except for K. polysporus (striped bar).


