
Table 2.
CpG and G + C content of L1 human (Hsa) and chimpanzee (Ptr) orthologs and their flanking DNA
Click on table to view larger version.
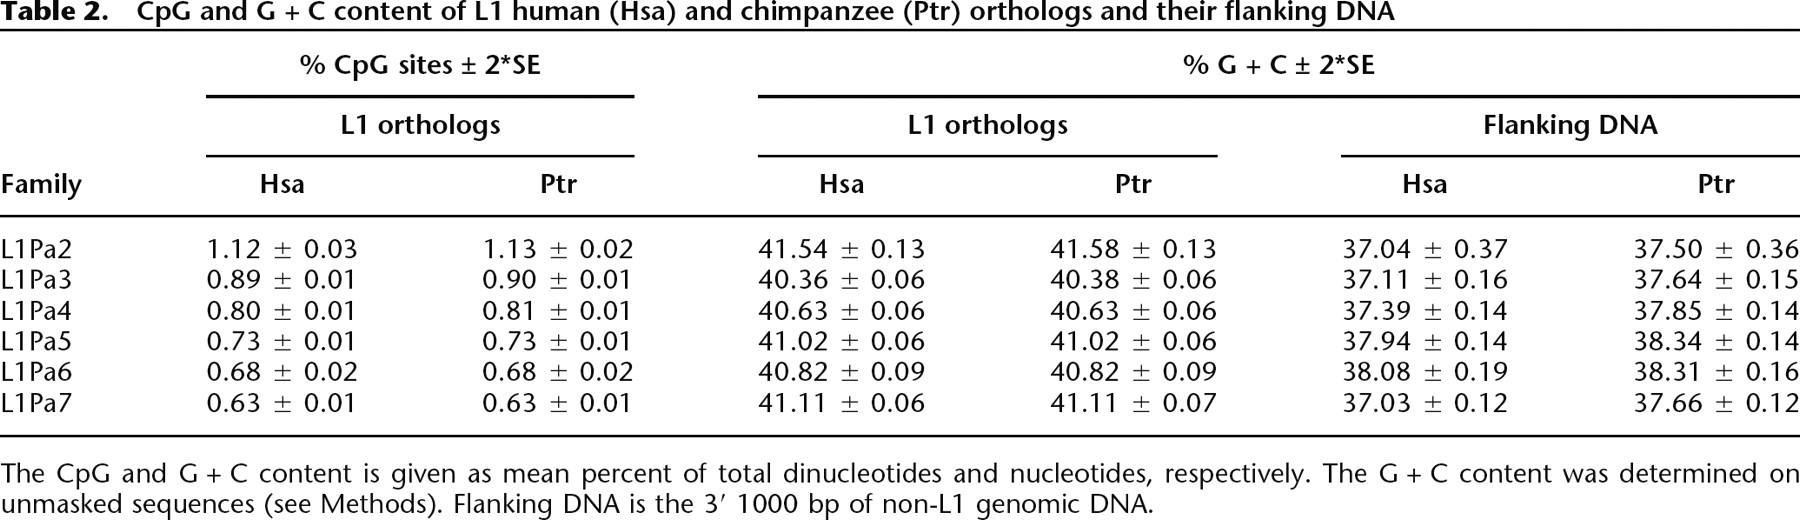
The CpG and G + C content is given as mean percent of total dinucleotides and nucleotides, respectively. The G + C content was determined on unmasked sequences (see Methods). Flanking DNA is the 3′ 1000 bp of non-L1 genomic DNA.


