
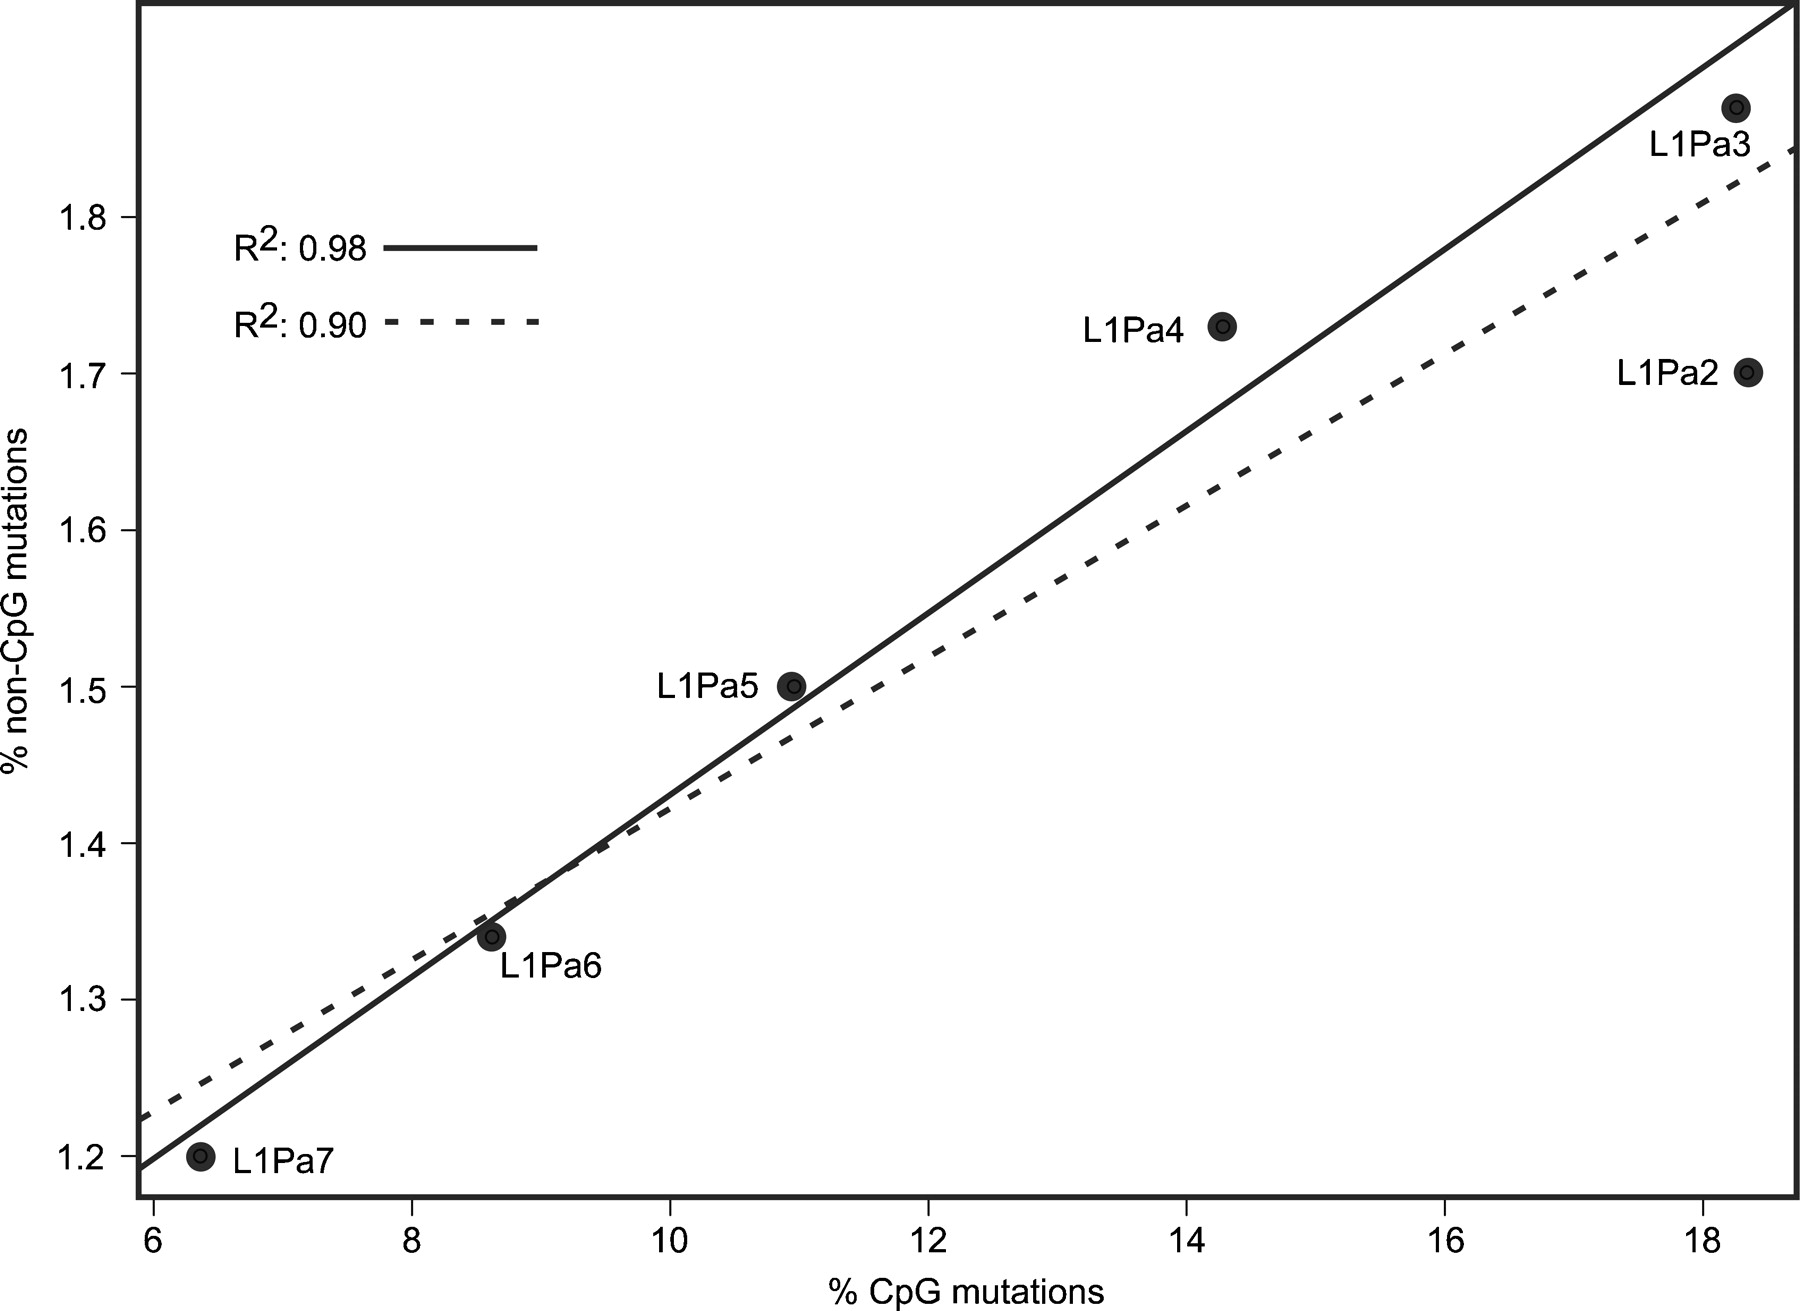
The relationship between the percentage of non-CpG and CpG mutations. Both classes of mutations for the L1 orthologs were determined as described in the Methods. We calculated the correlation coefficient both with (dashed line) and without (solid line) the L1Pa2 orthologs because the orthologs for this family were recovered at a far lower frequency than the older families (see text). As a result they provided only ∼3% as much DNA sequence (in Mb) of the total base pairs in our data set. The reduced data set for the L1Pa2 family could partly explain why the relationship between CpG content and divergence of this family is different from that expected from the other families. It may also explain why the divergences of the L1Pa2 orthologs differed far more between the chromosomes than that of the other families (Supplemental Fig. S6).


