
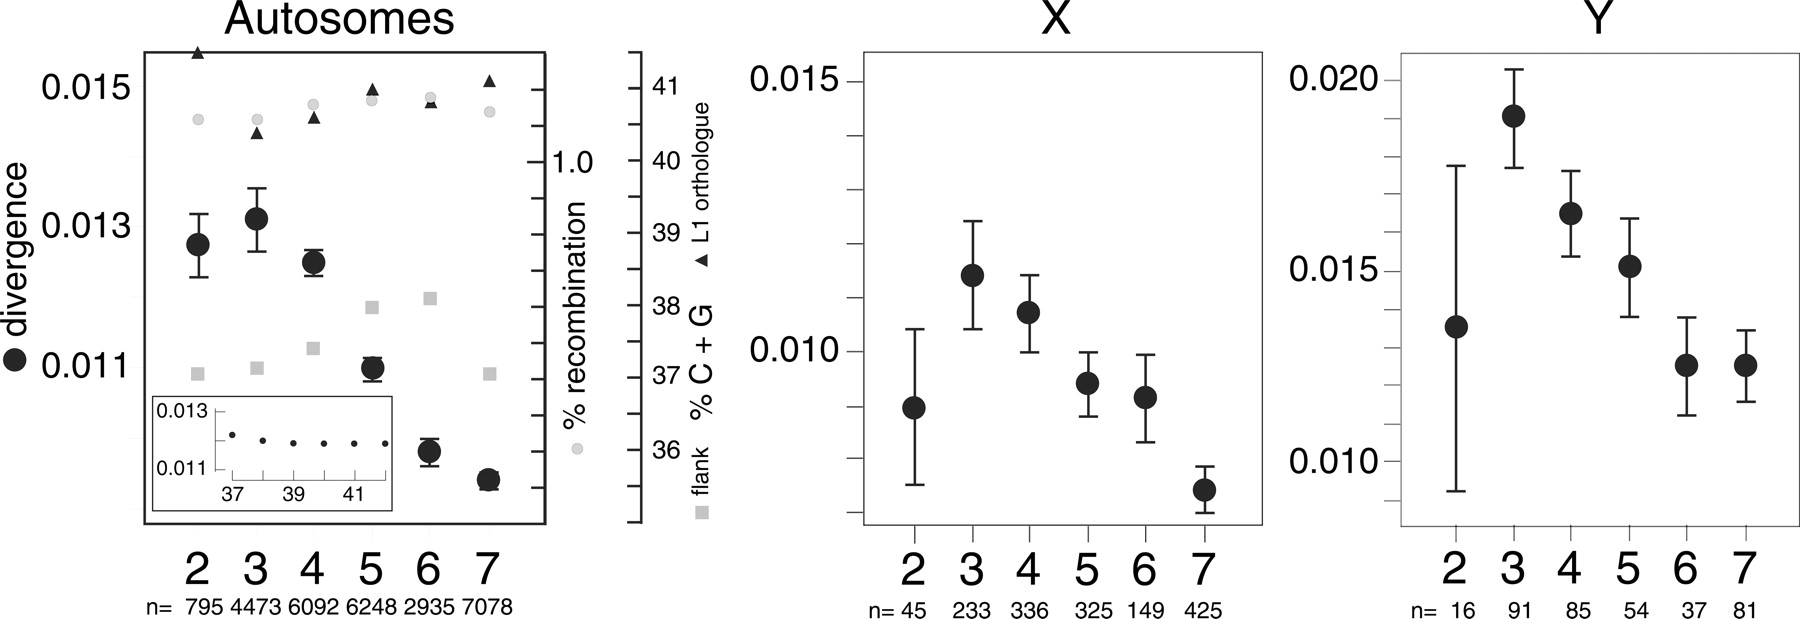
Divergence of autosomal and sex chromosomal members of different L1 families. The median (black circles) and confidence intervals around the median (Strelen 2004) of the non-CpG ortholog divergences for the L1Pa2–L1Pa7 families were determined as described in the Methods. The means of the recombination rates (gray circles) are shown for each L1 family (see Methods). Mean % G + C content for the human orthologs (filled triangles) and their flanking DNA from Table 2 (gray squares) are also given. The number (n) of ortholog pairs for each L1 family (2–7) is shown for the data used for the divergence measurements. We were able to assign recombination rates to ≥98% of the L1 orthologs. (Inset) Portion of the curve fit extracted from Figure 4 published by (Hellmann et al. 2005). The Y-axis shows the divergence between syntenic regions of the chimpanzee and human genomes as a function of G + C content (X-axis).


