
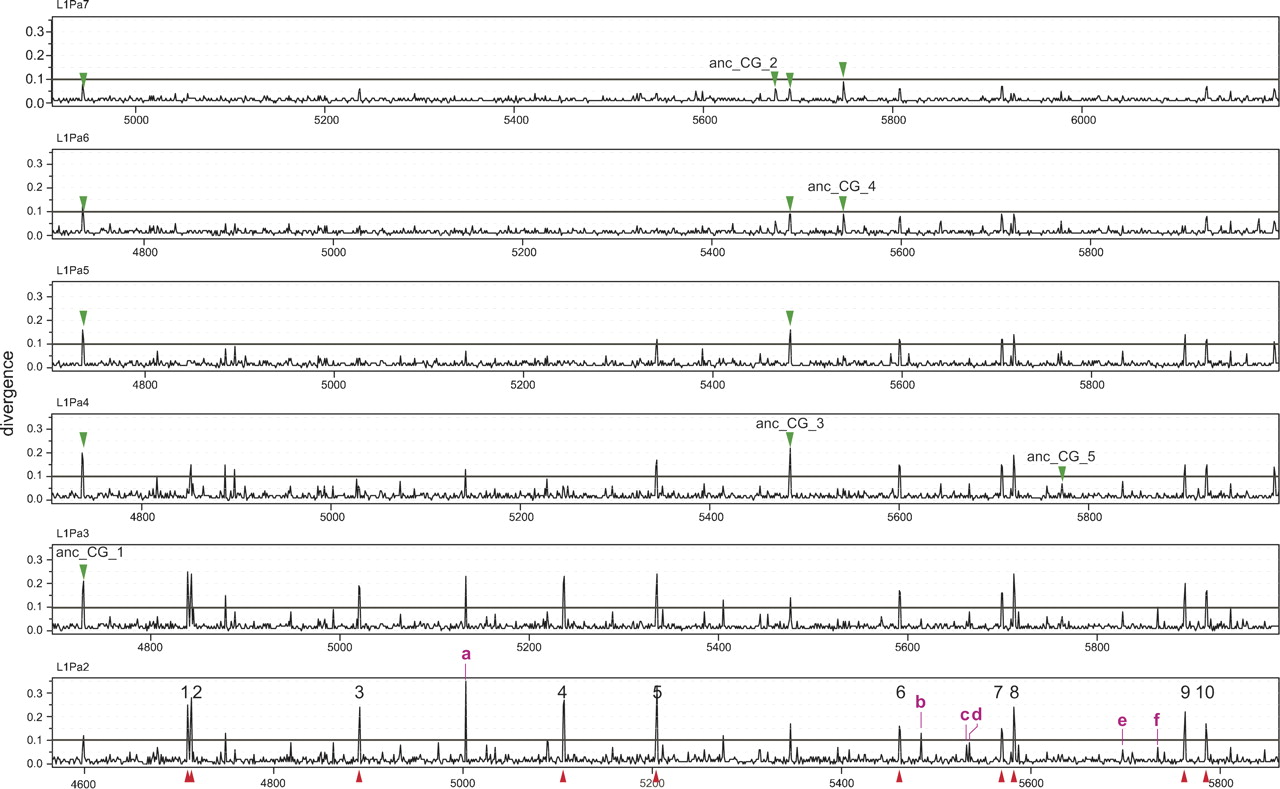
Divergence of L1 orthologs at single base pair resolution. The region shown corresponds to the 3′ 1200 bp of ORF2. The ordinate gives the fraction of the number of changes between the chimpanzee/human orthologs at each position. (Red triangles) CpGs present in L1Pa2, (lettered inverted green arrowheads) ancestral CpGs (ancCG_1, ancCG_2, etc.), (magenta lettered peaks) some non-CpG hot spots; only hotspot “d” corresponds to a CpT dinucleotide in L1Pa2 and L1Pa3 (see text). CpG hot spots are defined as a divergence >0.1 (solid line), and non-CpG hot spots as divergence >0.05. Also note that some CpG hot spots in the younger families persist as hot spots in the older families even after the frequency of CpGs in the older orthologs has fallen below the threshold value to appear as a CpG in the current consensus sequence (see Methods for definition of current and ancestral consensus sequences). An example of the data underlying this plot is shown for the 3′ 186 bp in Supplemental Figure S7.


