
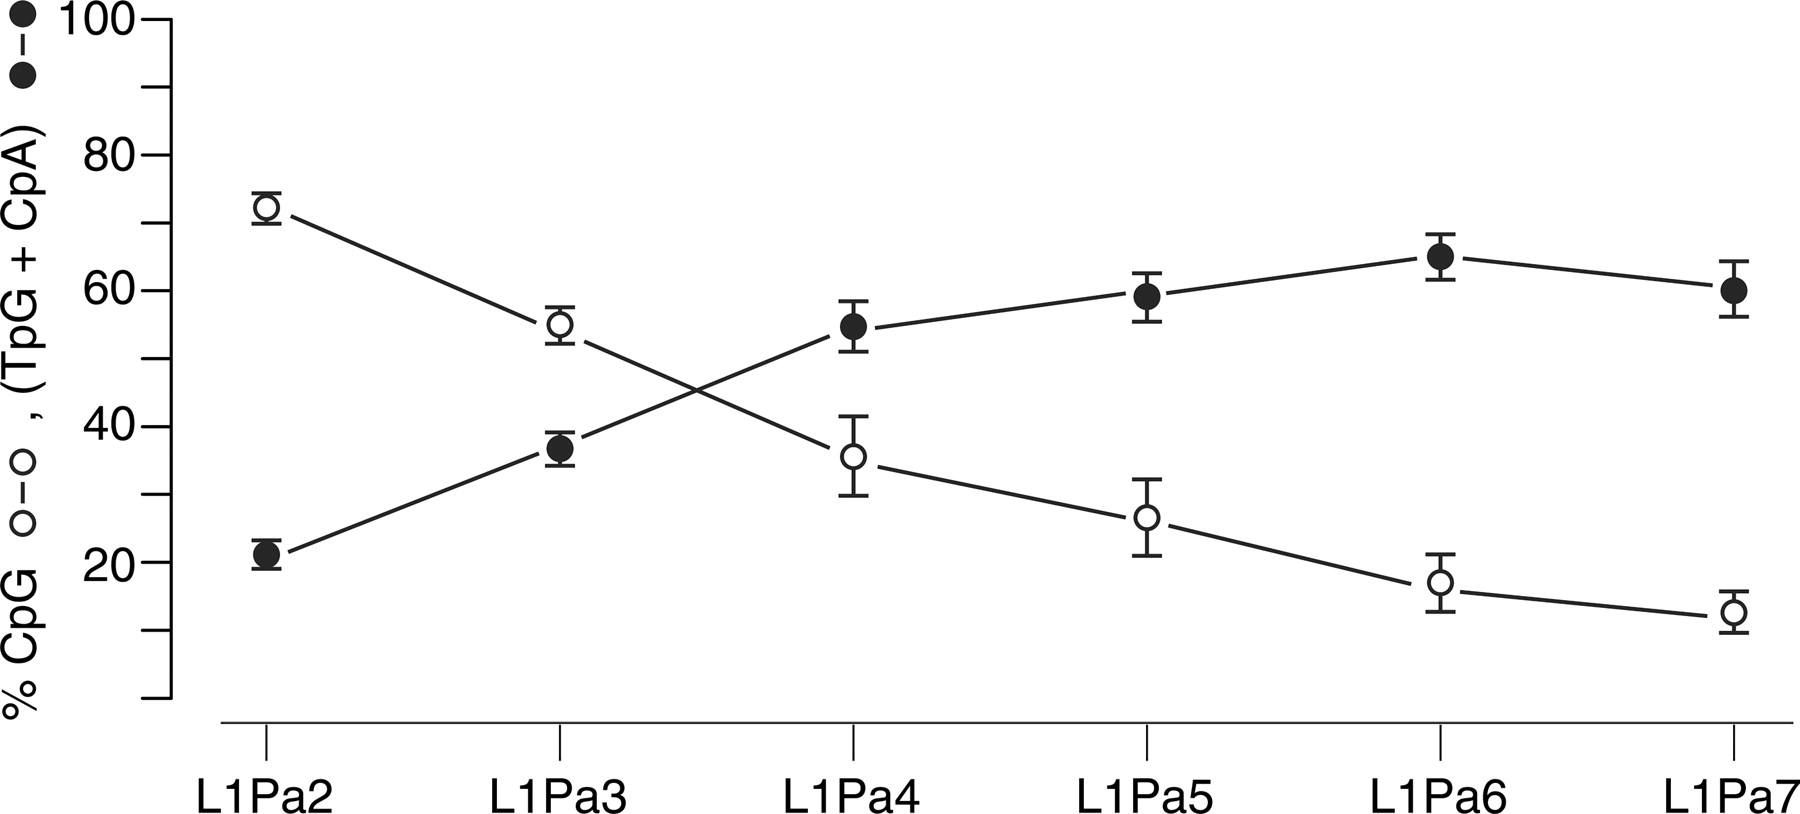
Figure 2.
Relative percentage of CpG and TpG (CpA) at corresponding nucleotide positions of various L1 families. This determination was made on full-length members aligned as described in the Methods. The ordinate gives the relative percentage of CpG and (TpG + CpA) in full-length members of the various L1 families at positions corresponding to a CpG in the relevant L1 family-specific ancestral consensus sequence. The sums of the [CpG + (TpG + CpA)] percentages range from ∼83% in the three oldest families (L1Pa5–L1Pa7) to ∼92% in the three younger families (L1Pa2–L1Pa4). Also see Supplemental Table S9.


