
Table 2.
Number of genes for which positive selection is detected
Click on table to view larger version.
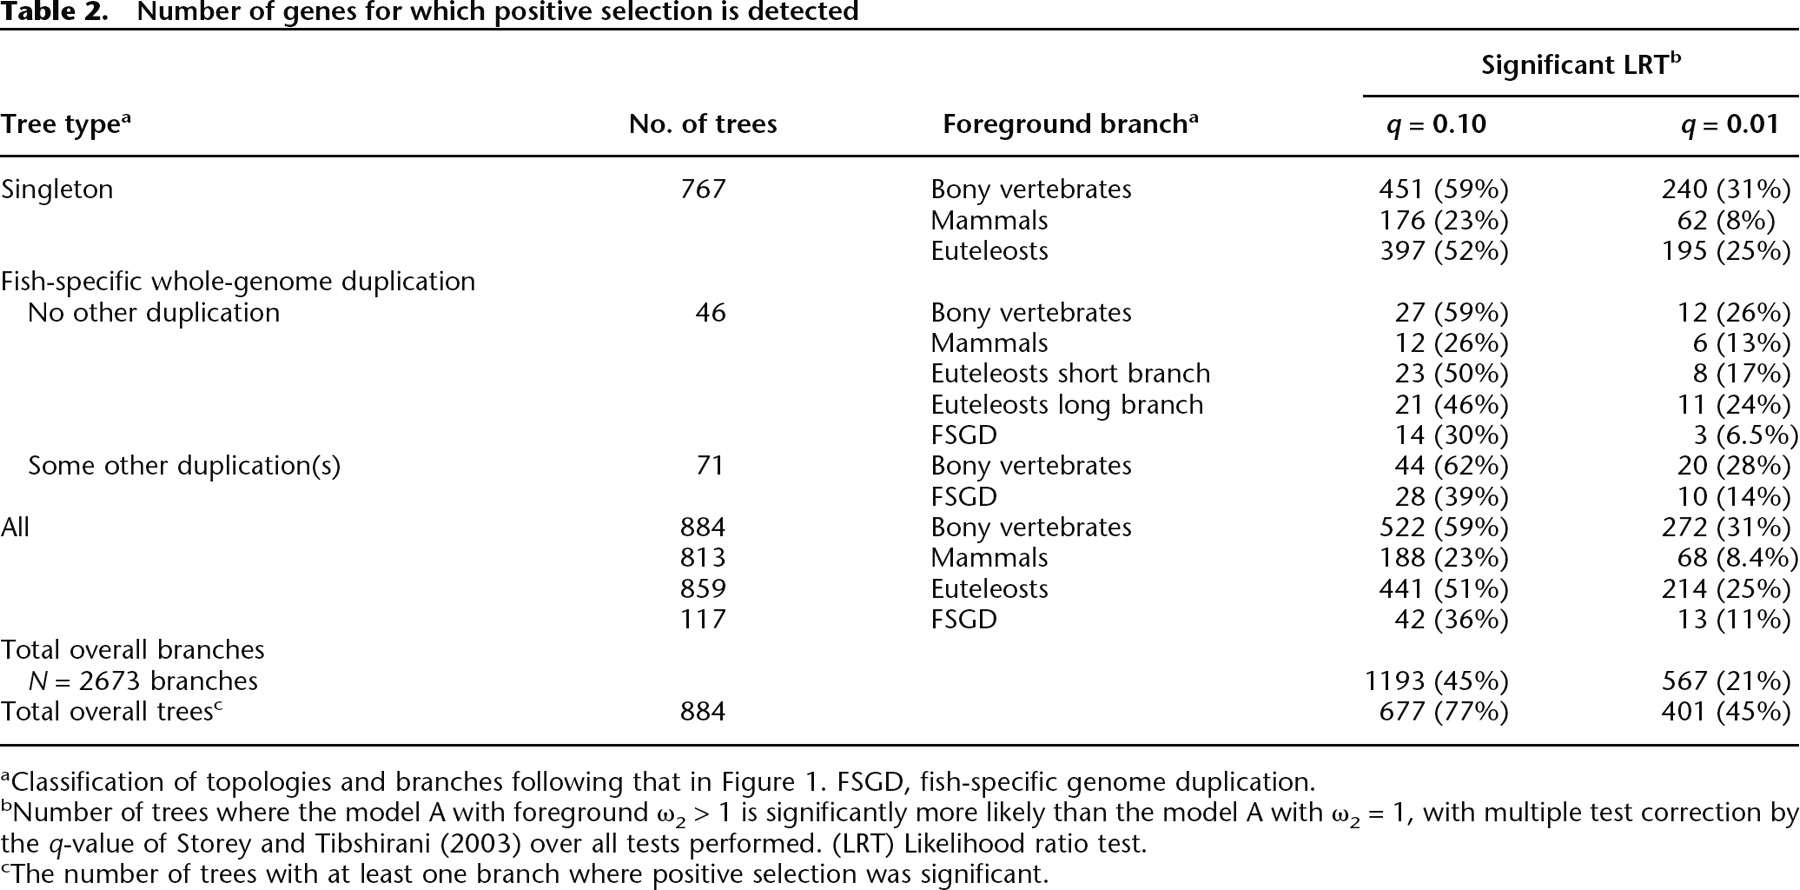
aClassification of topologies and branches following that in Figure 1. FSGD, fish-specific genome duplication.
bNumber of trees where the model A with foreground ω2 > 1 is significantly more likely than the model A with ω2 = 1, with multiple test correction by the q-value of Storey and Tibshirani (2003) over all tests performed. (LRT) Likelihood ratio test.
cThe number of trees with at least one branch where positive selection was significant.


