
Evaluation of the accuracy and power of the likelihood tests for positive selection using simulated data
Click on table to view larger version.
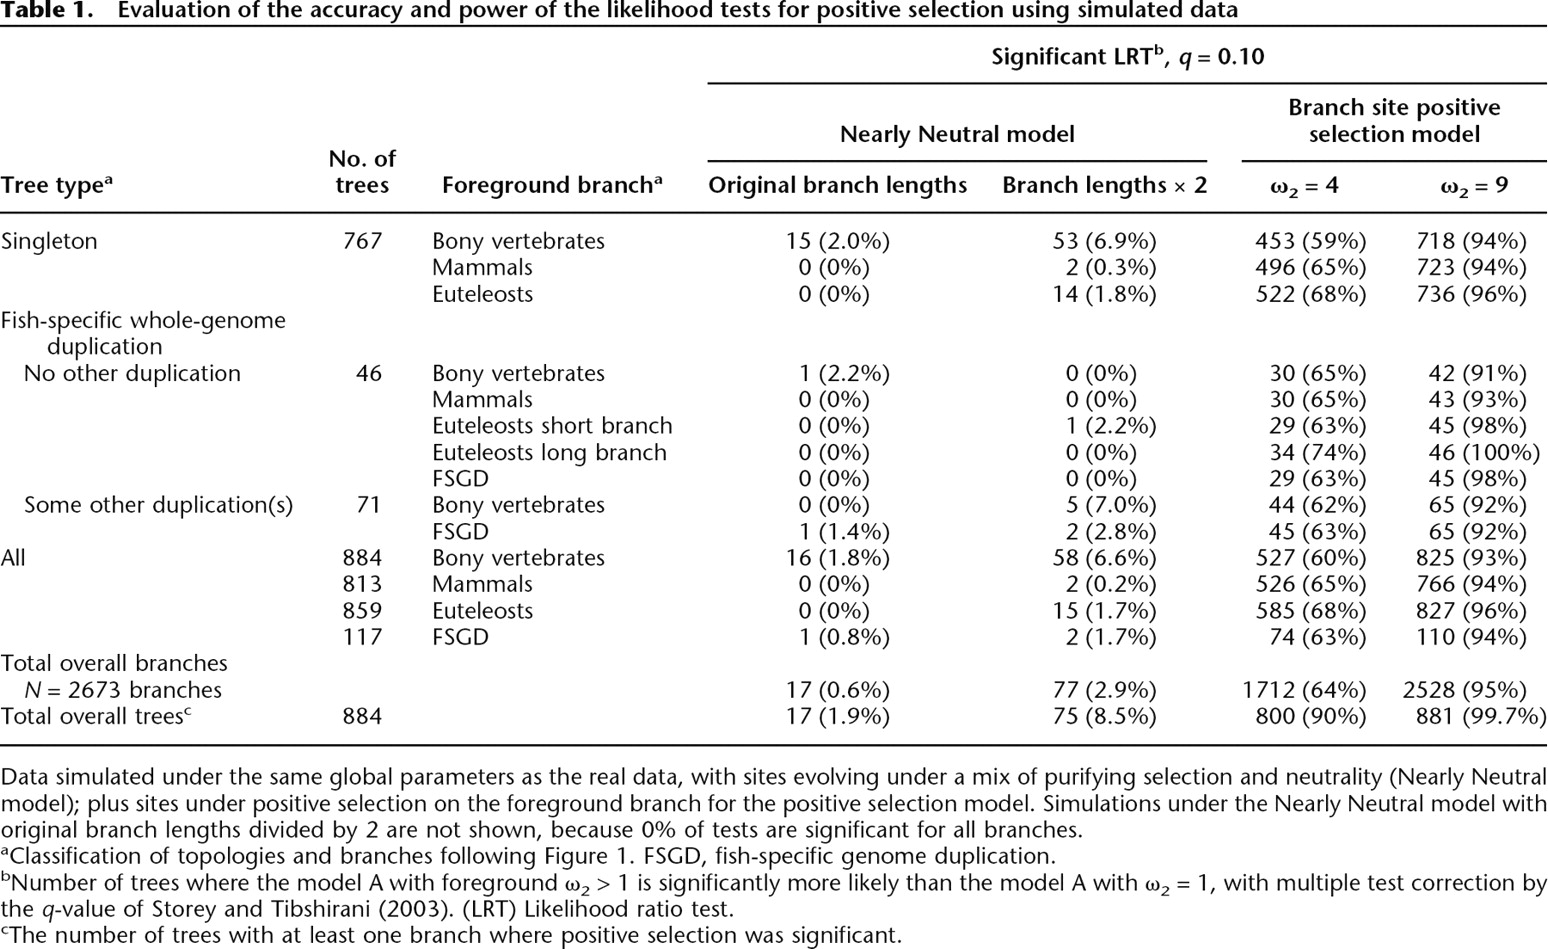
Data simulated under the same global parameters as the real data, with sites evolving under a mix of purifying selection and neutrality (Nearly Neutral model); plus sites under positive selection on the foreground branch for the positive selection model. Simulations under the Nearly Neutral model with original branch lengths divided by 2 are not shown, because 0% of tests are significant for all branches.
aClassification of topologies and branches following Figure 1. FSGD, fish-specific genome duplication.
bNumber of trees where the model A with foreground ω2 > 1 is significantly more likely than the model A with ω2 = 1, with multiple test correction by the q-value of Storey and Tibshirani (2003). (LRT) Likelihood ratio test.
cThe number of trees with at least one branch where positive selection was significant.


