
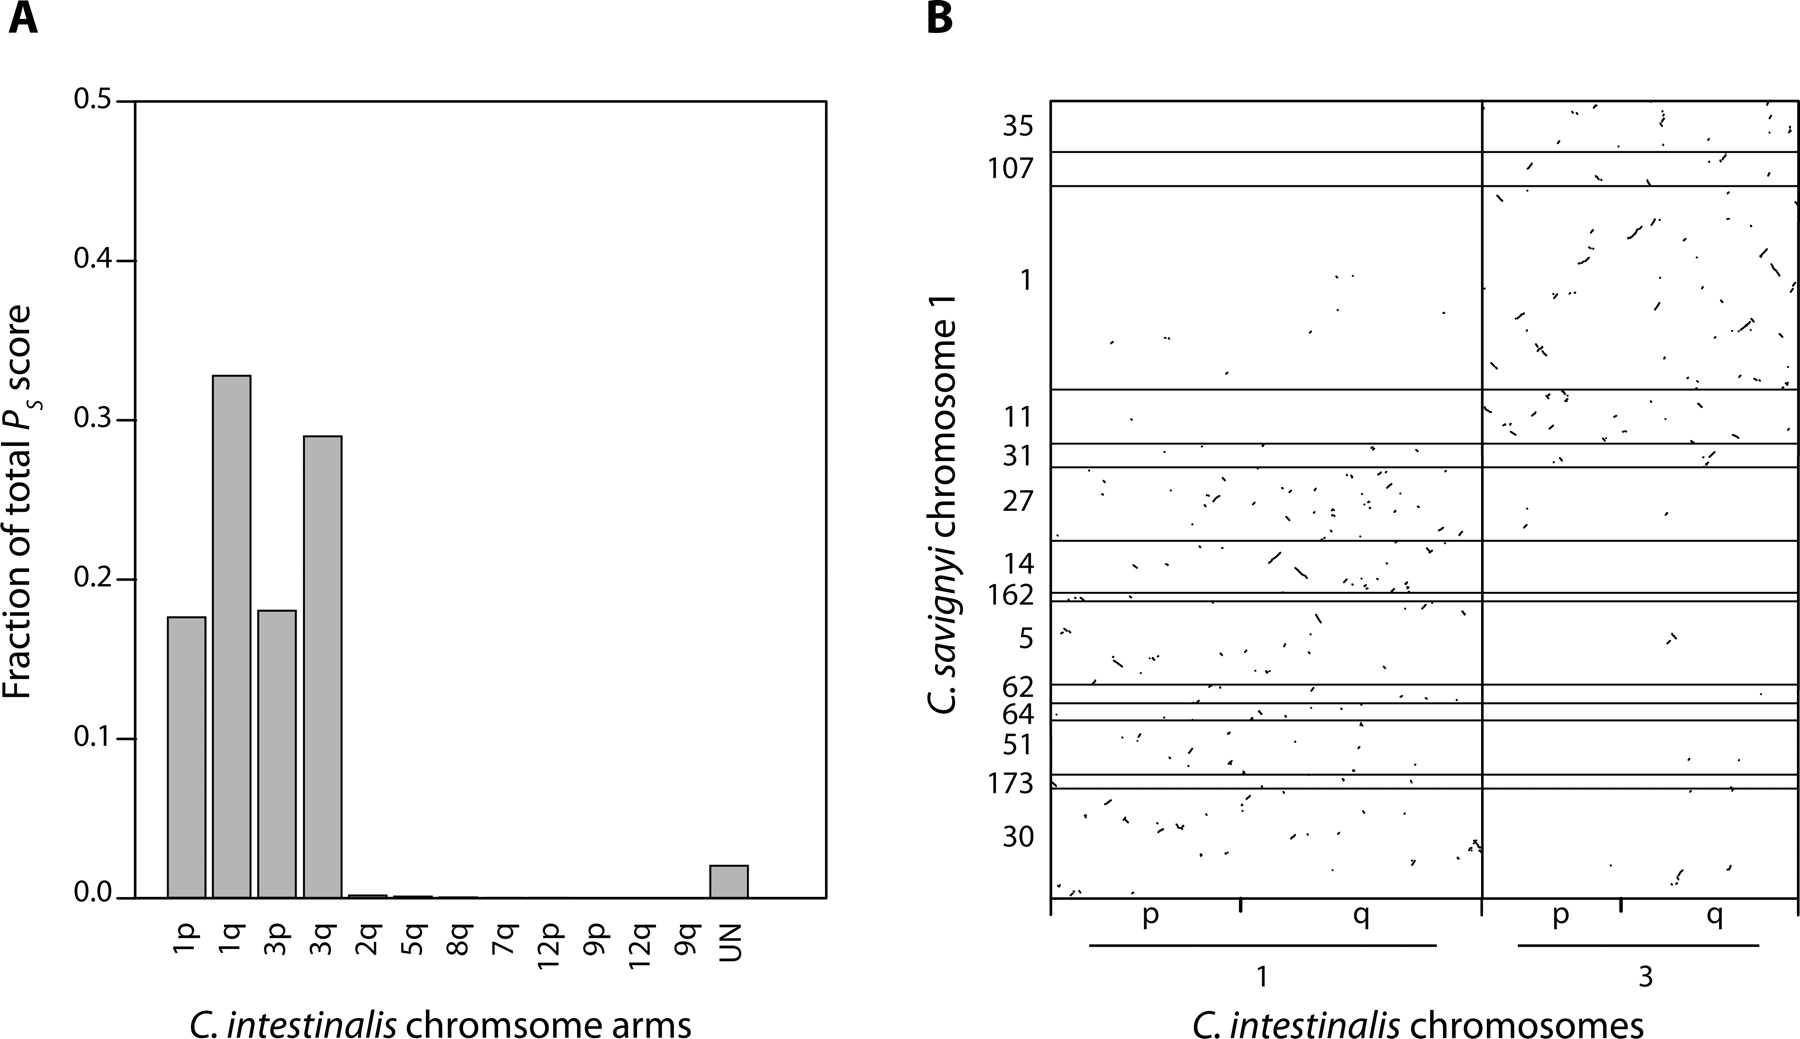
Conserved synteny between C. savignyi chromosome 1 and both chromosomes 1 and 3 of C. intestinalis. (A) Fraction of total alignment score between C. savignyi chromosome 1 and the various chromosome arms of C. intestinalis. The majority of alignments involve chromosomes 1 and 3. Alignments to unmapped C. intestinalis scaffolds were aggregated and labeled “UN.” (B) Distribution of alignments between C. savignyi chromosomes 1 and C. intestinalis chromosomes 1 and 3. Alignments cluster in specific subregions. Black horizontal lines indicate boundaries between the ordered reftigs of chromosome 1. Minor ticks indicate the boundary between the short (p) and long (q) arms of the C. intestinalis chromosomes. The aspect ratio of the plot is one.


