
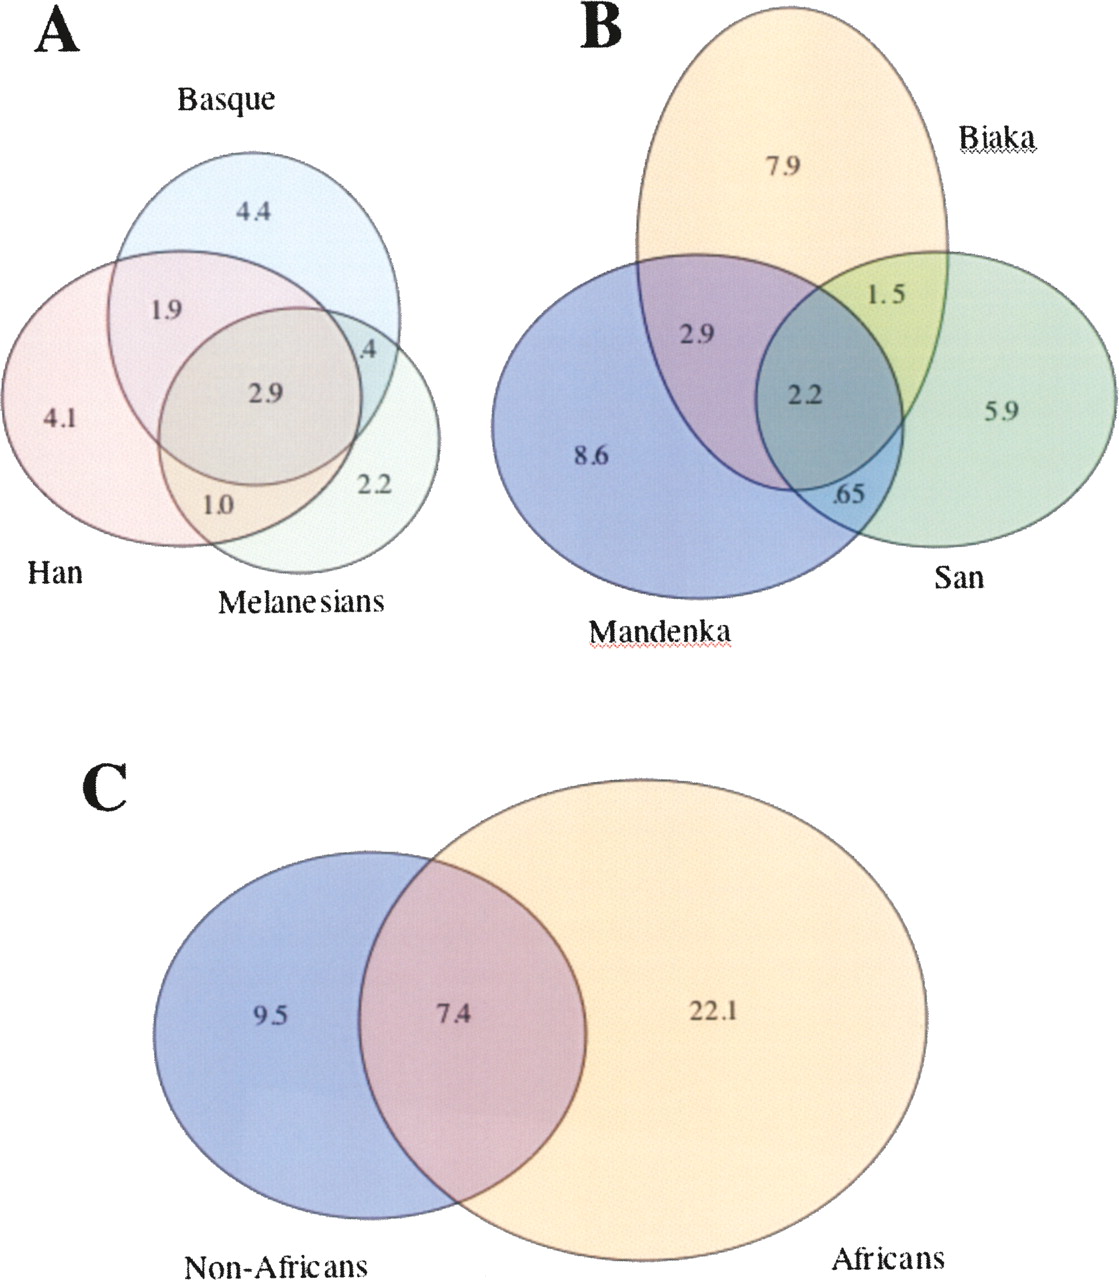
Figure 2.
Haplotype Venn diagrams based on phased autosomal sequence data. Numbers refer to the average number of distinct haplotypes for each of the 20 regions. See Methods for details.


