
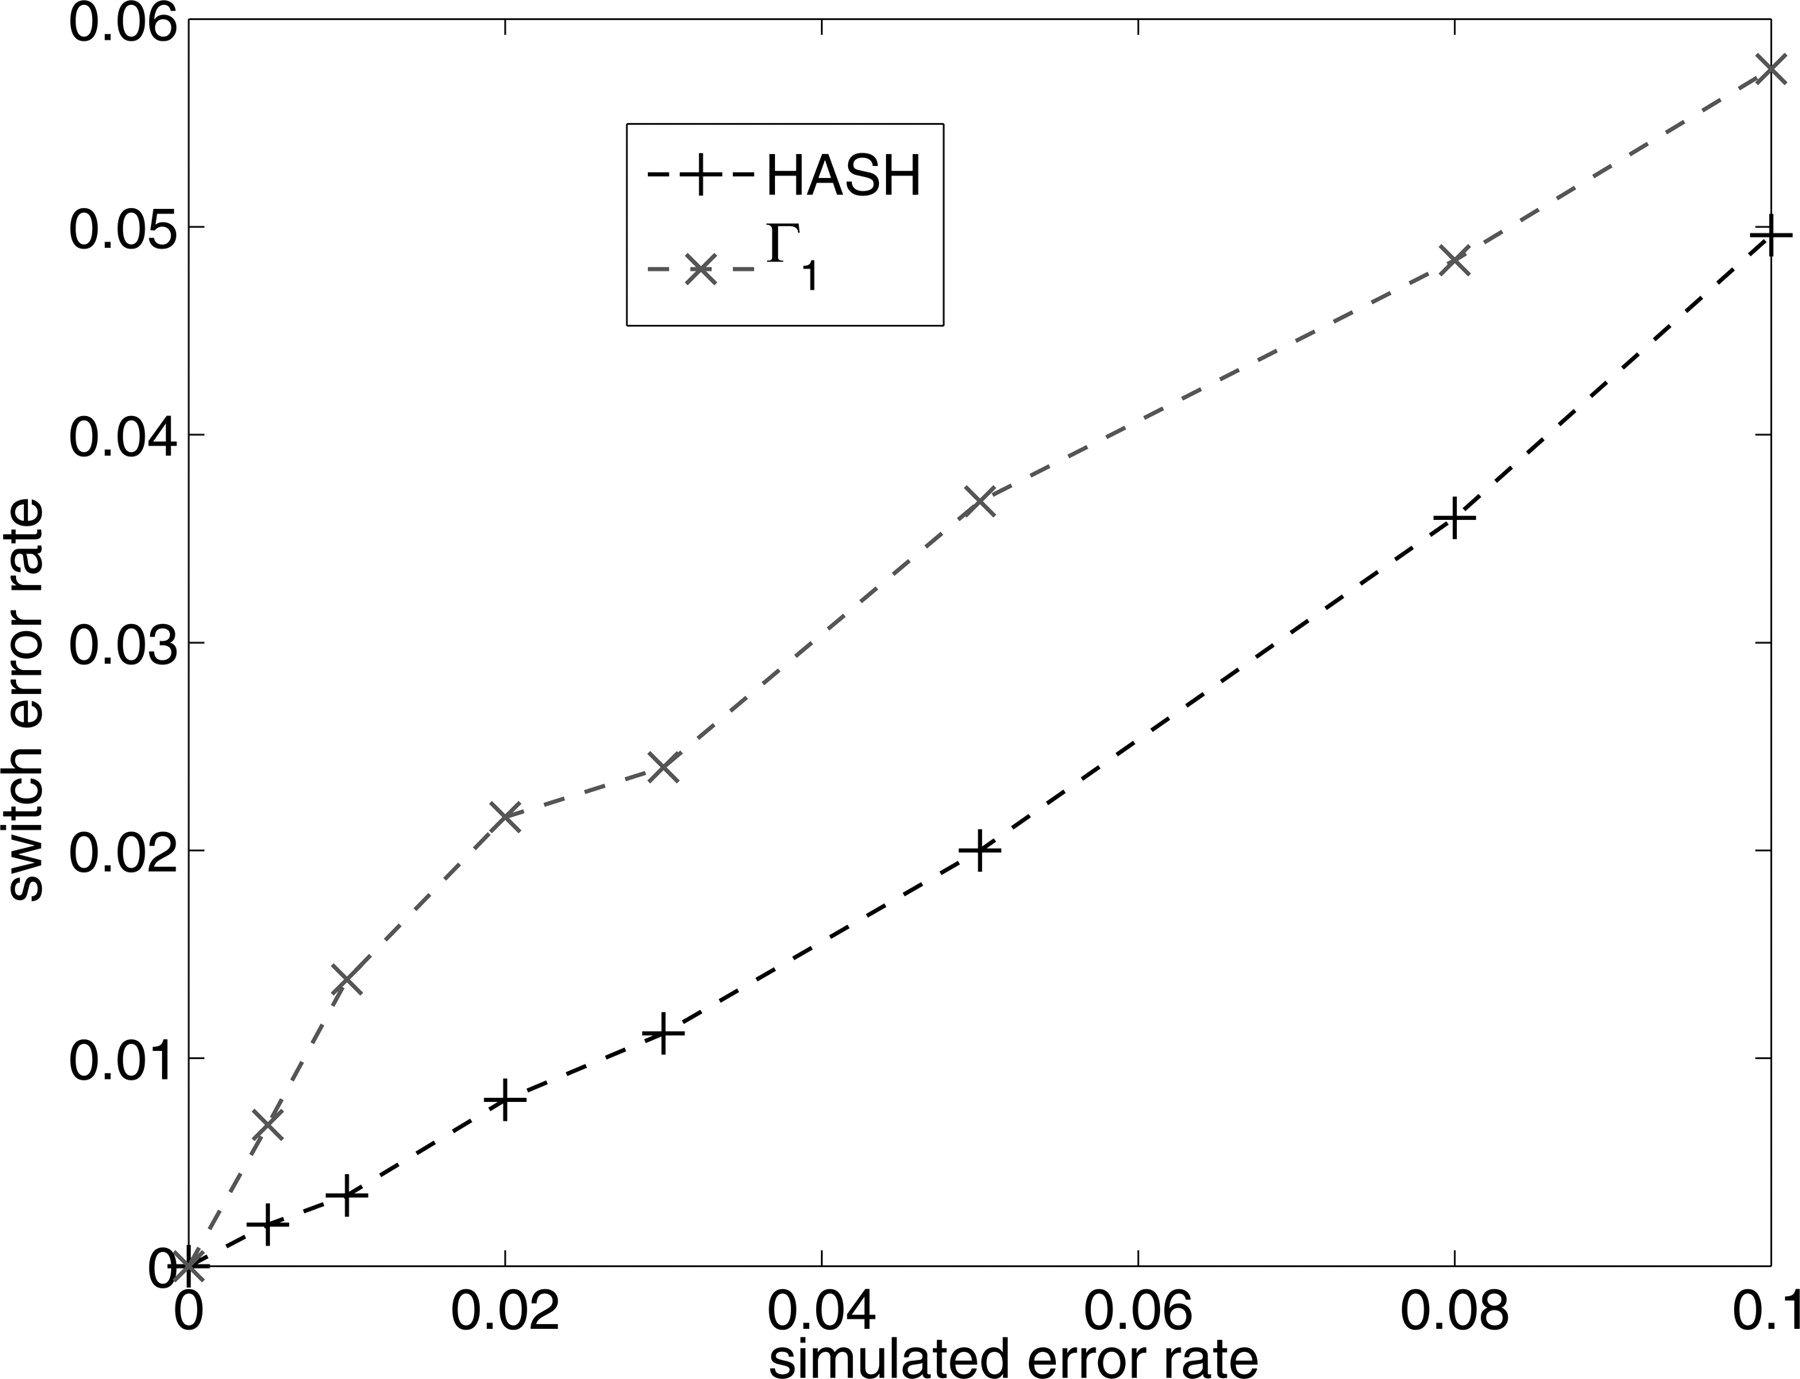
Figure 4.
Comparison of the switch error rate for the algorithm HASH and the MCMC algorithm with Γ1. The Y-axis is the average switch distance of the reconstructed haplotypes from the true haplotypes. The X-axis (simulated error rate) is the fraction of variant calls in the fragment matrix that were flipped.


