
Table 2.
Key tail probabilities for the Ped/Pop statistic, each estimated from the simulation study of Figure 5 (described in the text)
Click on table to view larger version.
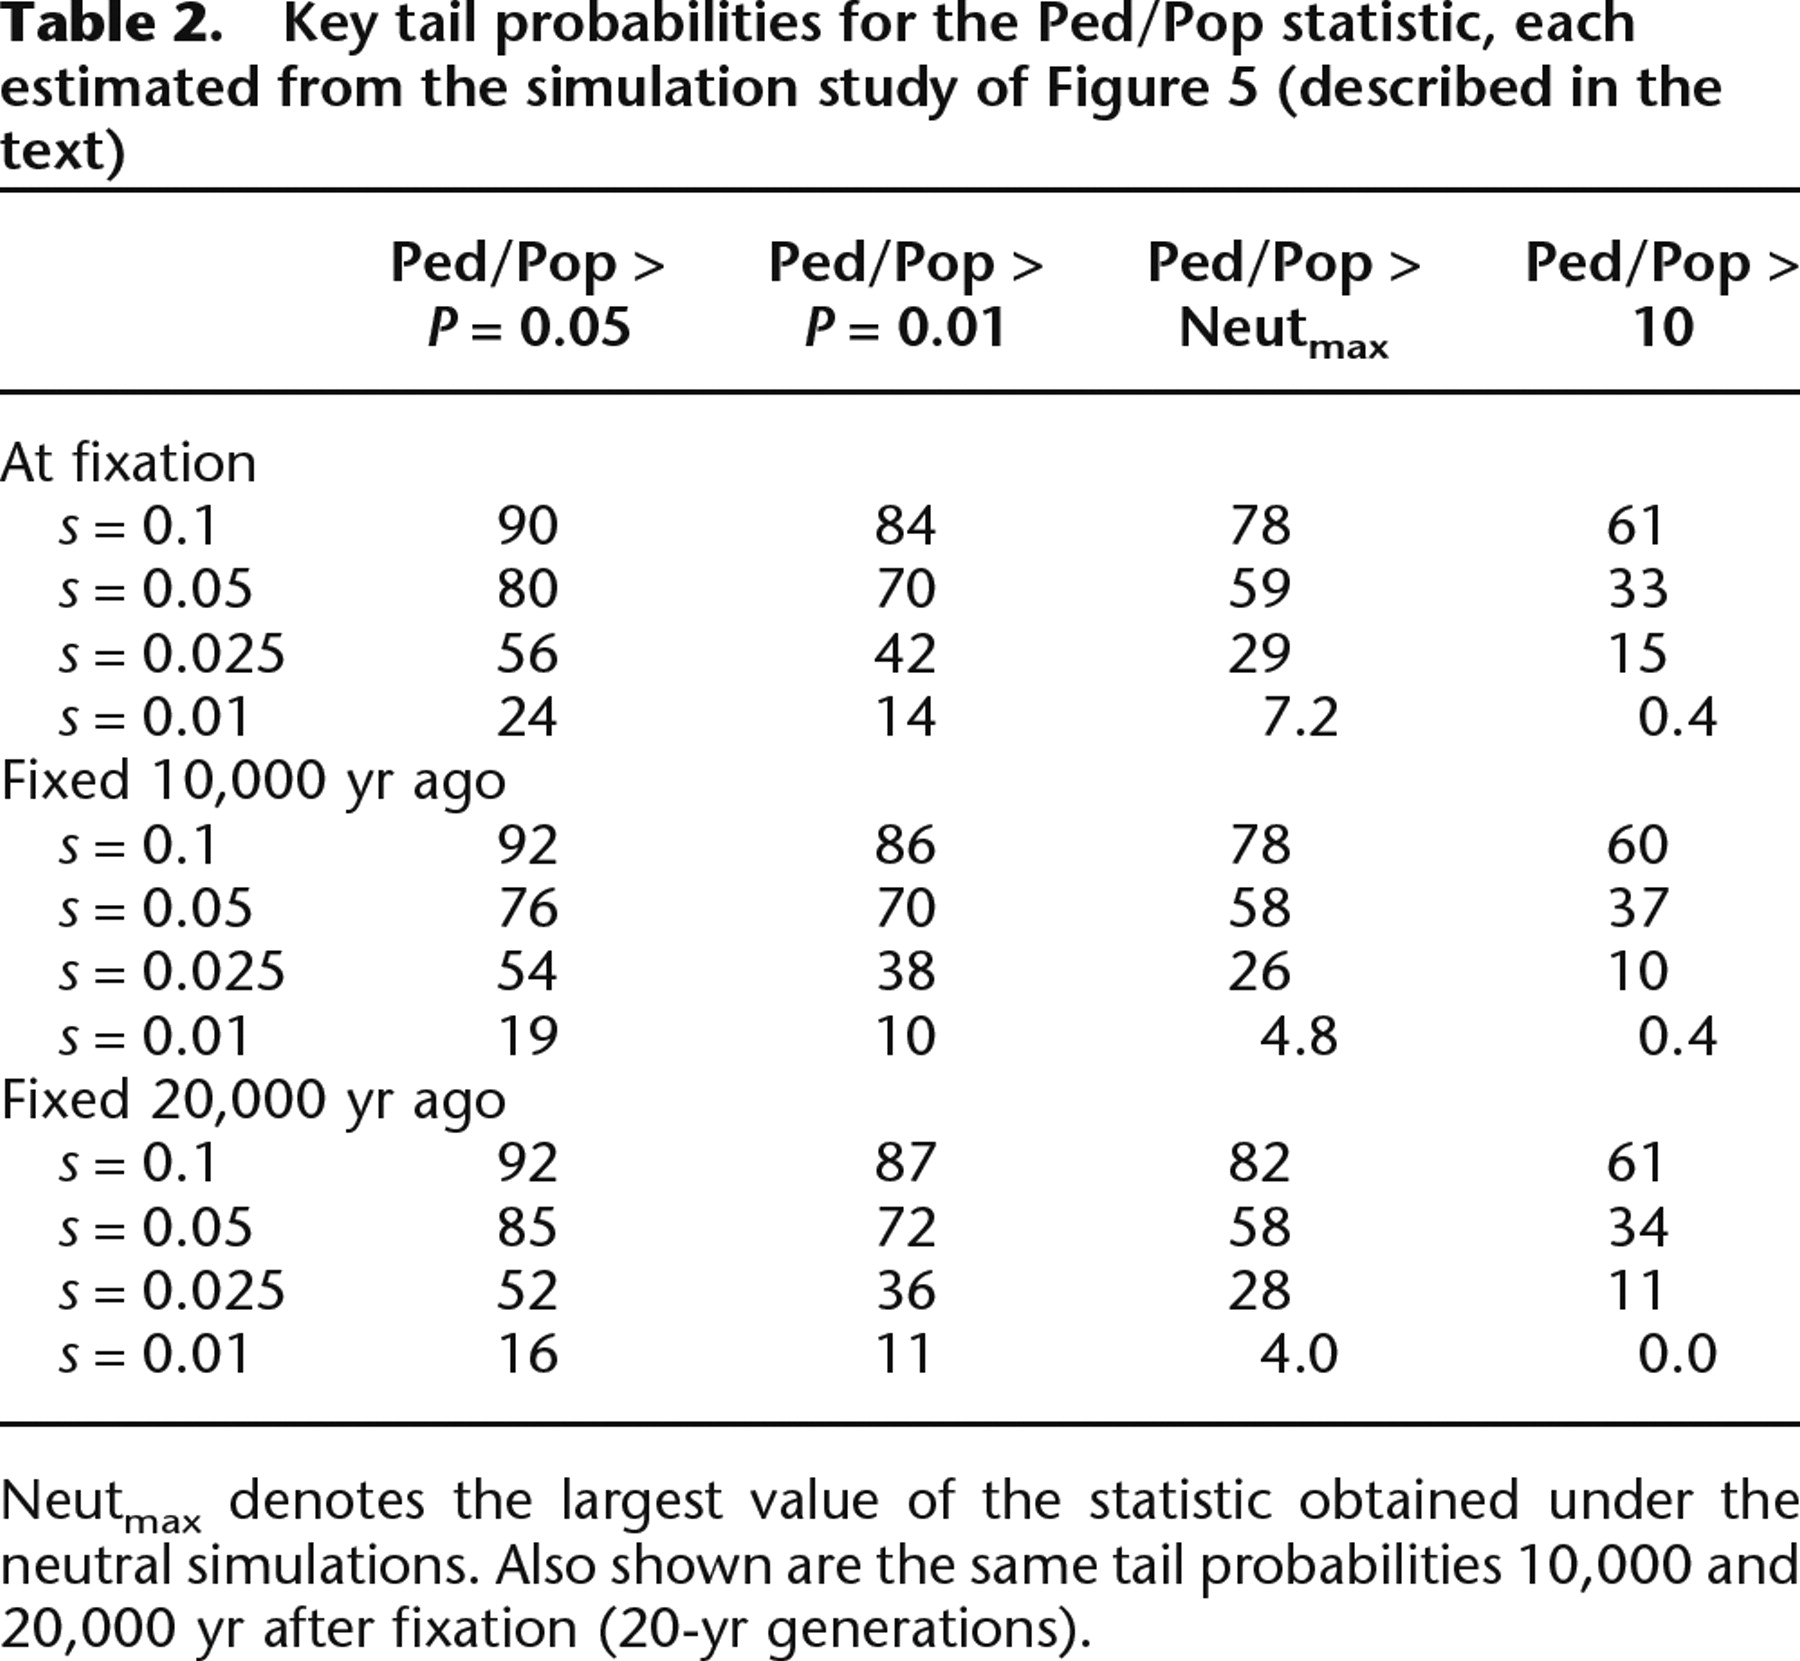
Neutmax denotes the largest value of the statistic obtained under the neutral simulations. Also shown are the same tail probabilities 10,000 and 20,000 yr after fixation (20-yr generations).


