
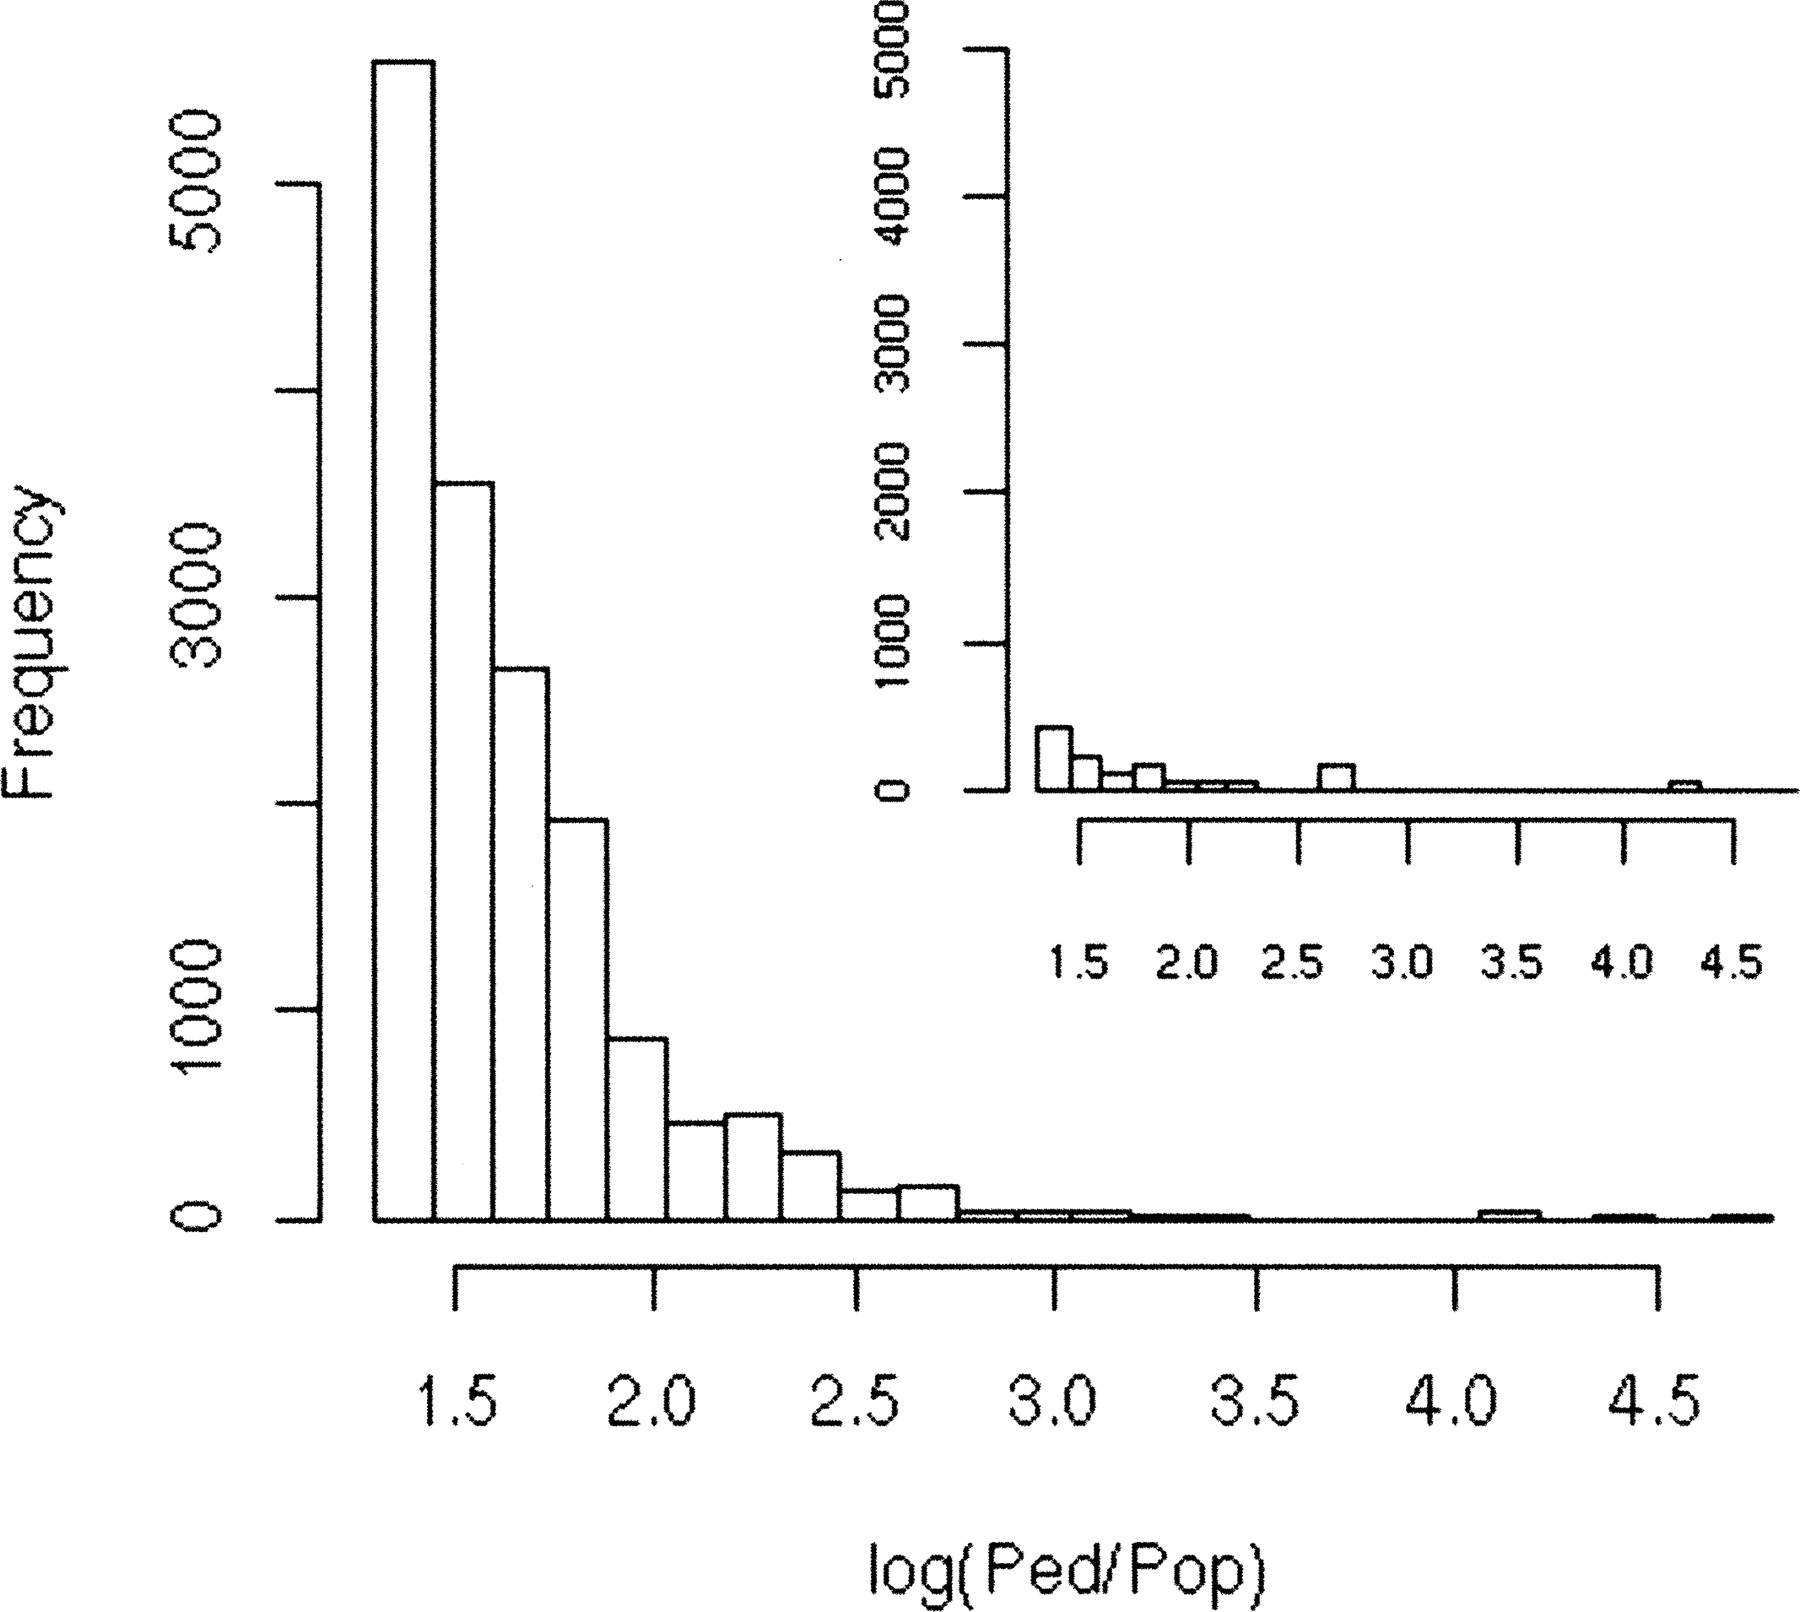
Figure 7.
The main histogram represents the right-extreme of the empirical log10(Ped/Pop) distribution (Ped/Pop >20) from the combined scans for selection (HapMap and Perlegen data sets). The inset depicts the corresponding histogram for the Schaffner null distribution.


