
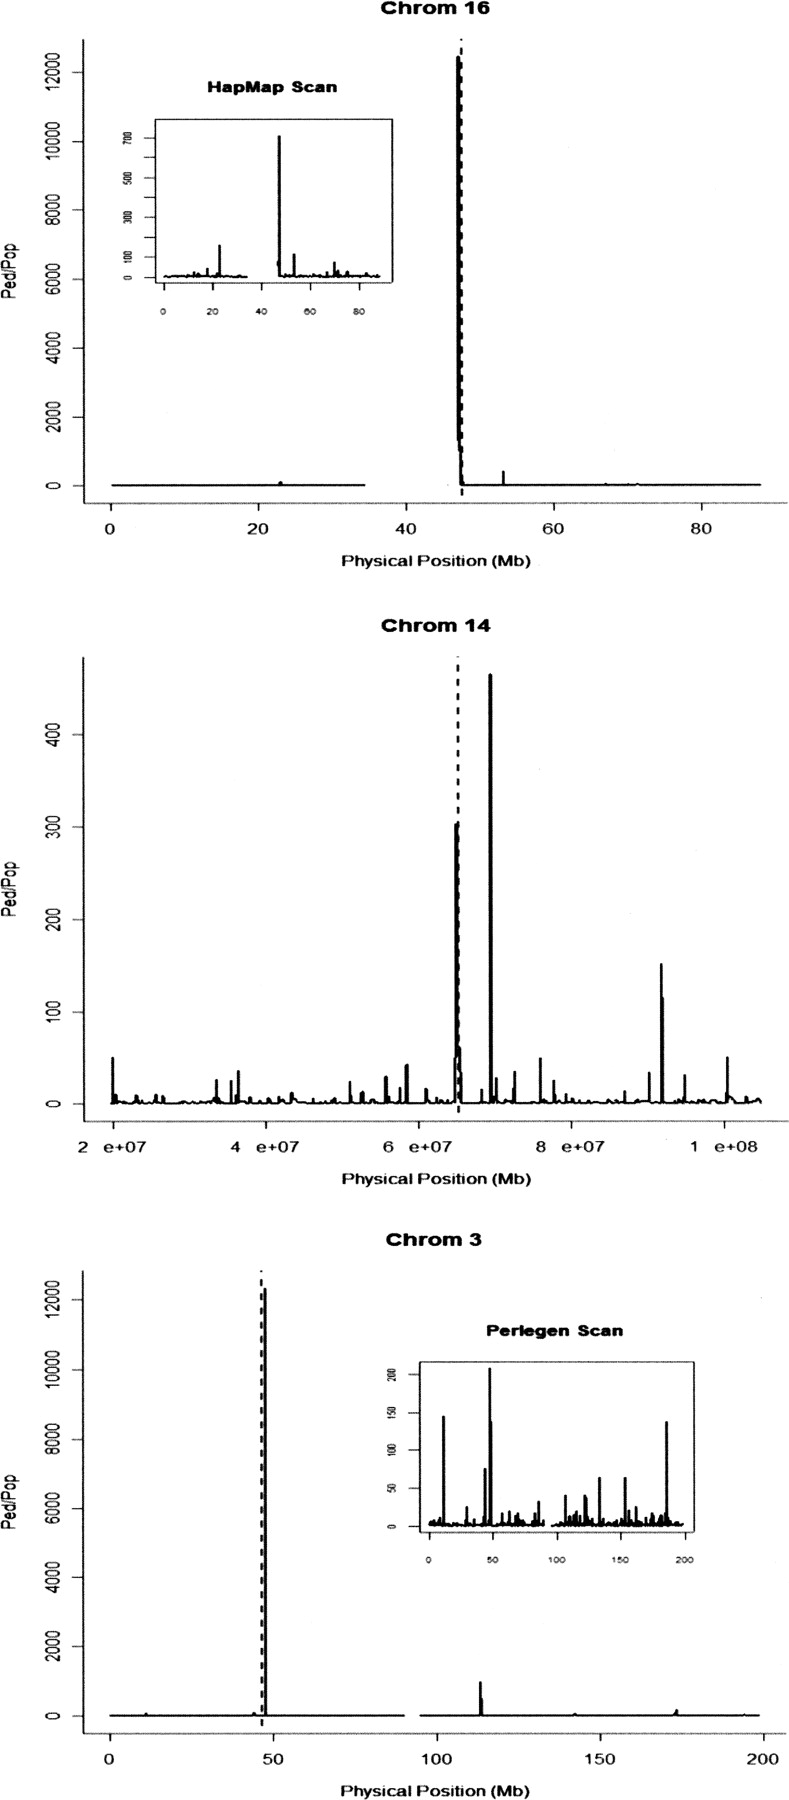
Figure 6.
Ped/Pop values over three human chromosomes. Chromosomes 16 and 14 show replications of HapMap candidates from Table 1 (highlighted with dashed line) from the Perlegen scan (chr 16 panel includes inset of HapMap scan), while the chromosome 3 plot shows the close proximity of the CCR5 gene (dashed lines) with the extreme outlier signal from the HapMap scan (Perlegen scan, inset).


