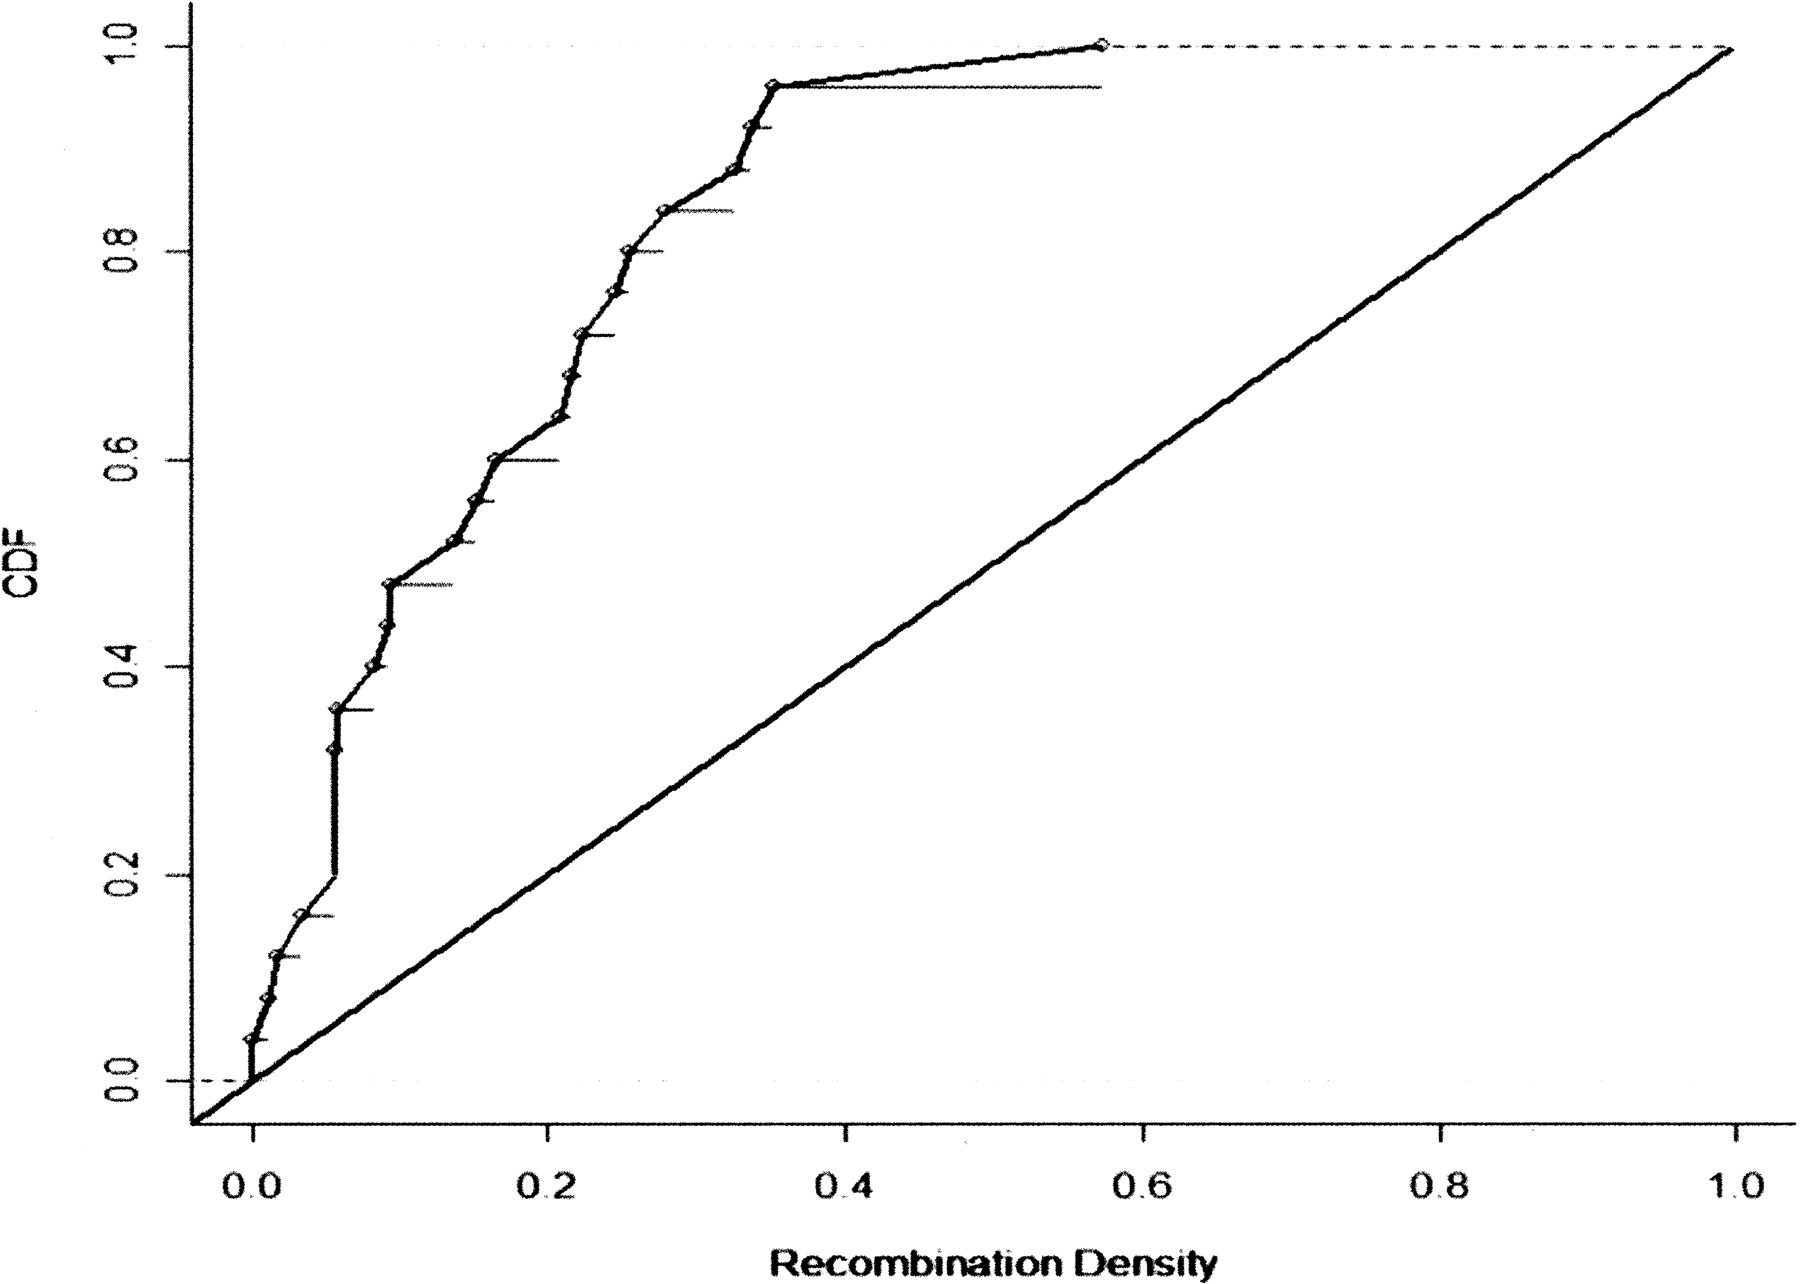
Confounding between recombination and selection, and the Ped/Pop method for detecting selection

(Downloading may take up to 30 seconds. If the slide opens in your browser, select File -> Save As to save it.)

Click on image to view larger version.

Figure 3.
Figure 3.

Cumulative distribution functions of the uniform distribution (diagonal line) and of the values in the final column of Table 1. The Kolmogorov-Smirnov statistic D is the maximum vertical distance between the two. Here, D = 0.61 which gives P = 1.9 × 10⁻⁸.

This Article

  1. Genome Res. 18: 1304-1313

Preprint Server