
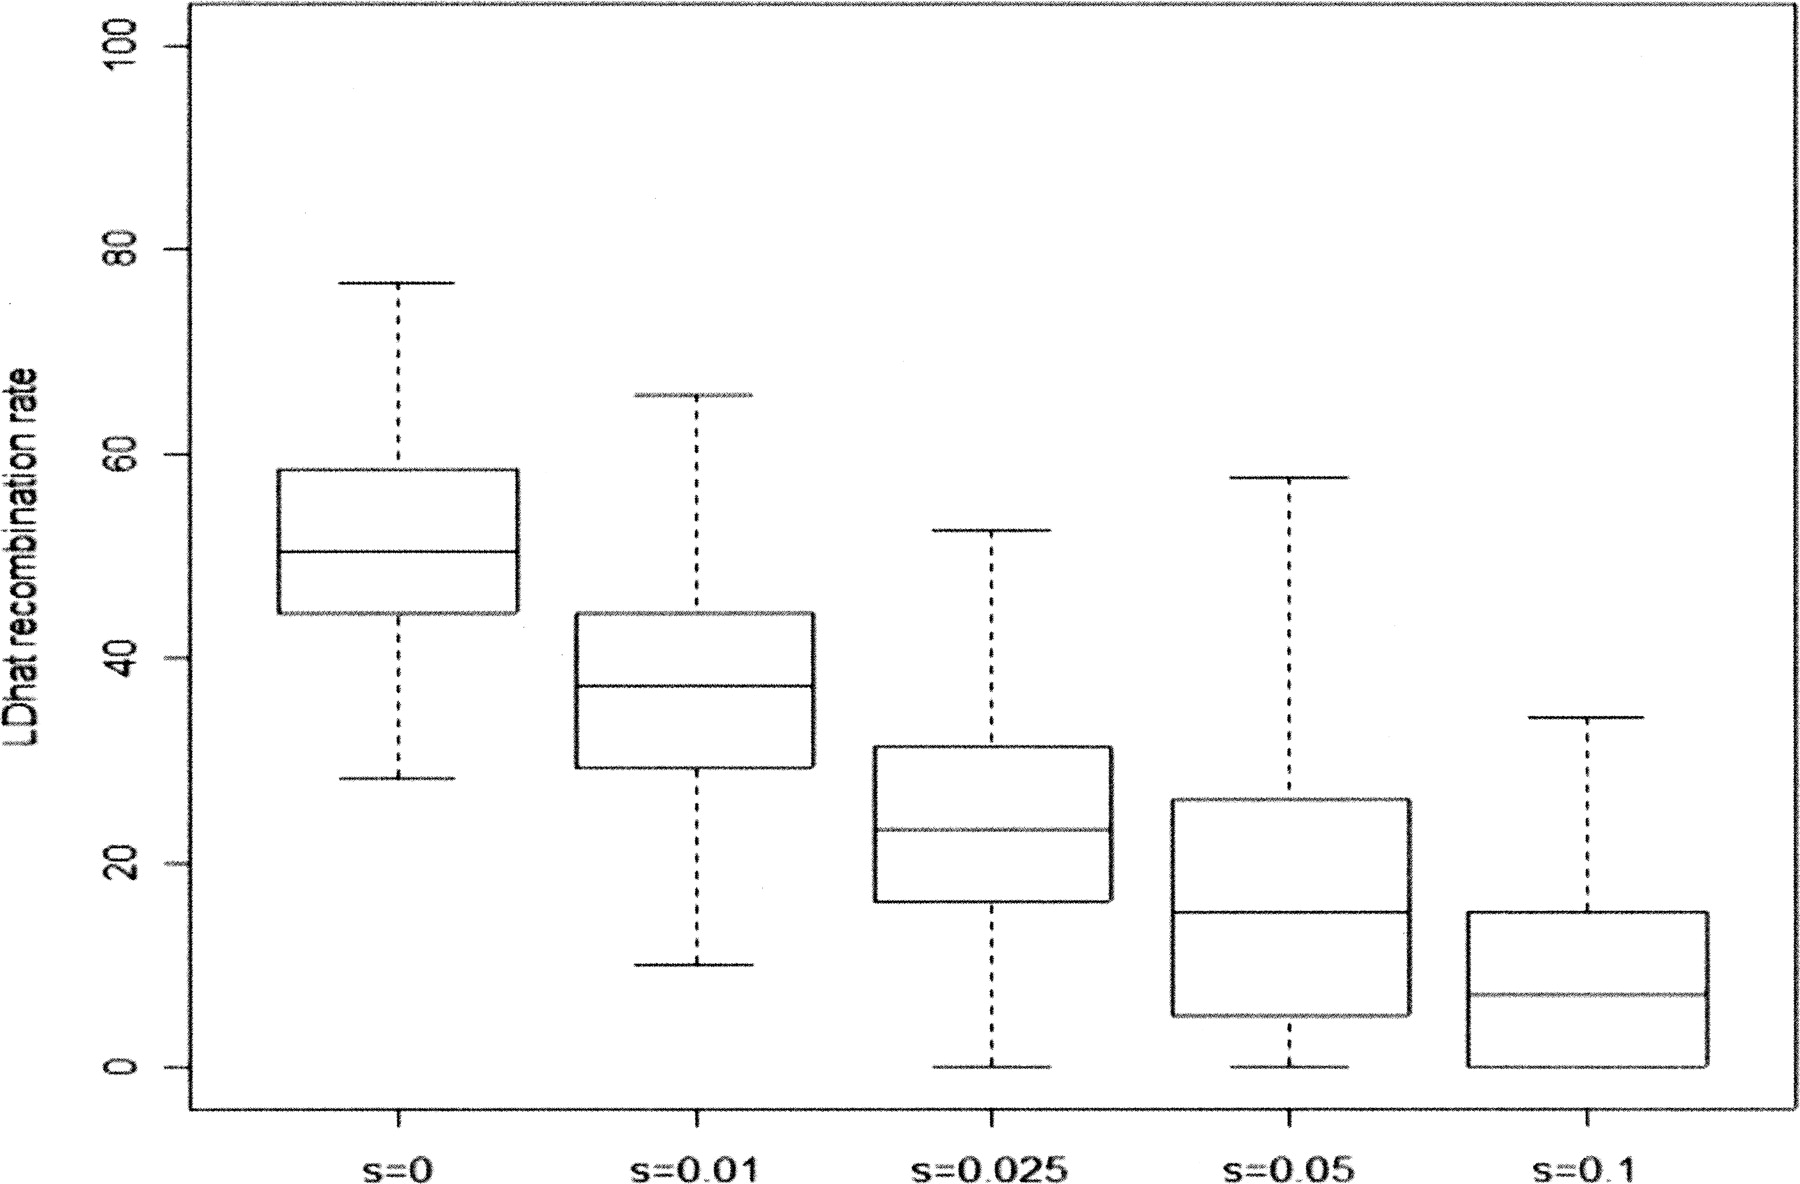
Figure 2.
Boxplots summarizing the distribution of LDhat recombination rate estimates from 100 chromosomes sequenced in 100-kb regions, simulated using SelSim to have at the center a positively selected variant with (unscaled) selection coefficient s. The pairwise algorithm of LDhat was used; 250 regions were simulated for each value of s; the effective population size was 104 diploid individuals; and the scaled recombination and mutation rates in each region were Rho = 50 and Theta = 100. The individual estimates underlying the s = 0 and s = 0.1 boxplots are displayed in Supplemental Figure S1.


