
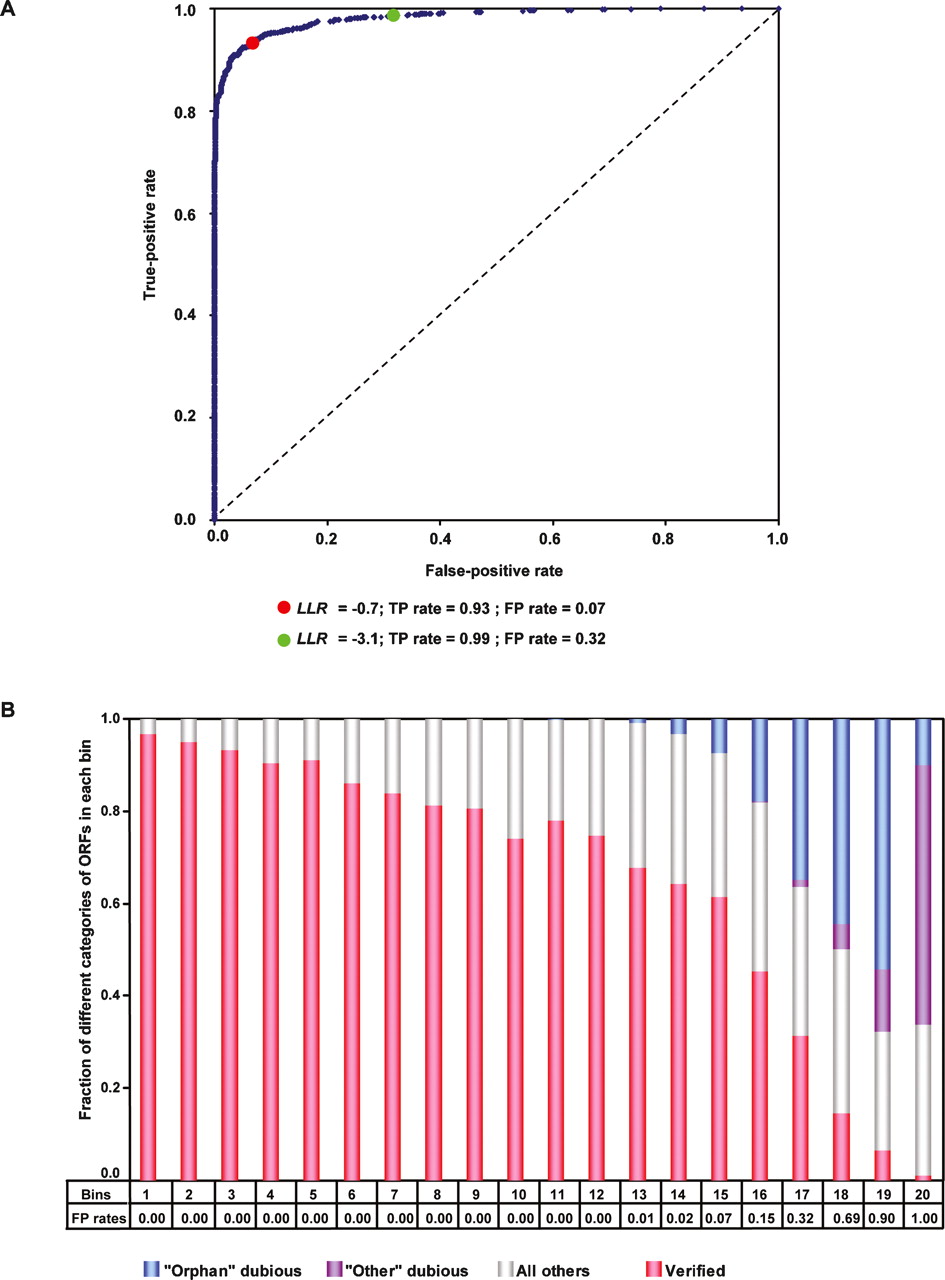
Evaluating functionality of S. cerevisiae ORFs. (A) ROC curve (blue) for naïve Bayes predictions based on 13 functional genomics and proteomics data sets. The diagonal (black dotted line) is the expected ROC curve for random, where the TP rate equals the FP rate. The two LLR cutoffs highlighted on the curve were used later as thresholds for categorizing orphan ORFs. (B) All 6718 S. cerevisiae ORFs were divided into 20 bins by decreasing LLR. Each bin has similar numbers of ORFs. The false-positive rates associated with the minimum LLR in each bin are listed. Distributions of verified ORFs, orphan dubious ORFs, “other” dubious ORFs, and all other ORFs in each bin are shown. Orphan dubious ORFs tend to have a higher LLR than ORFs classified as dubious for other reasons.


