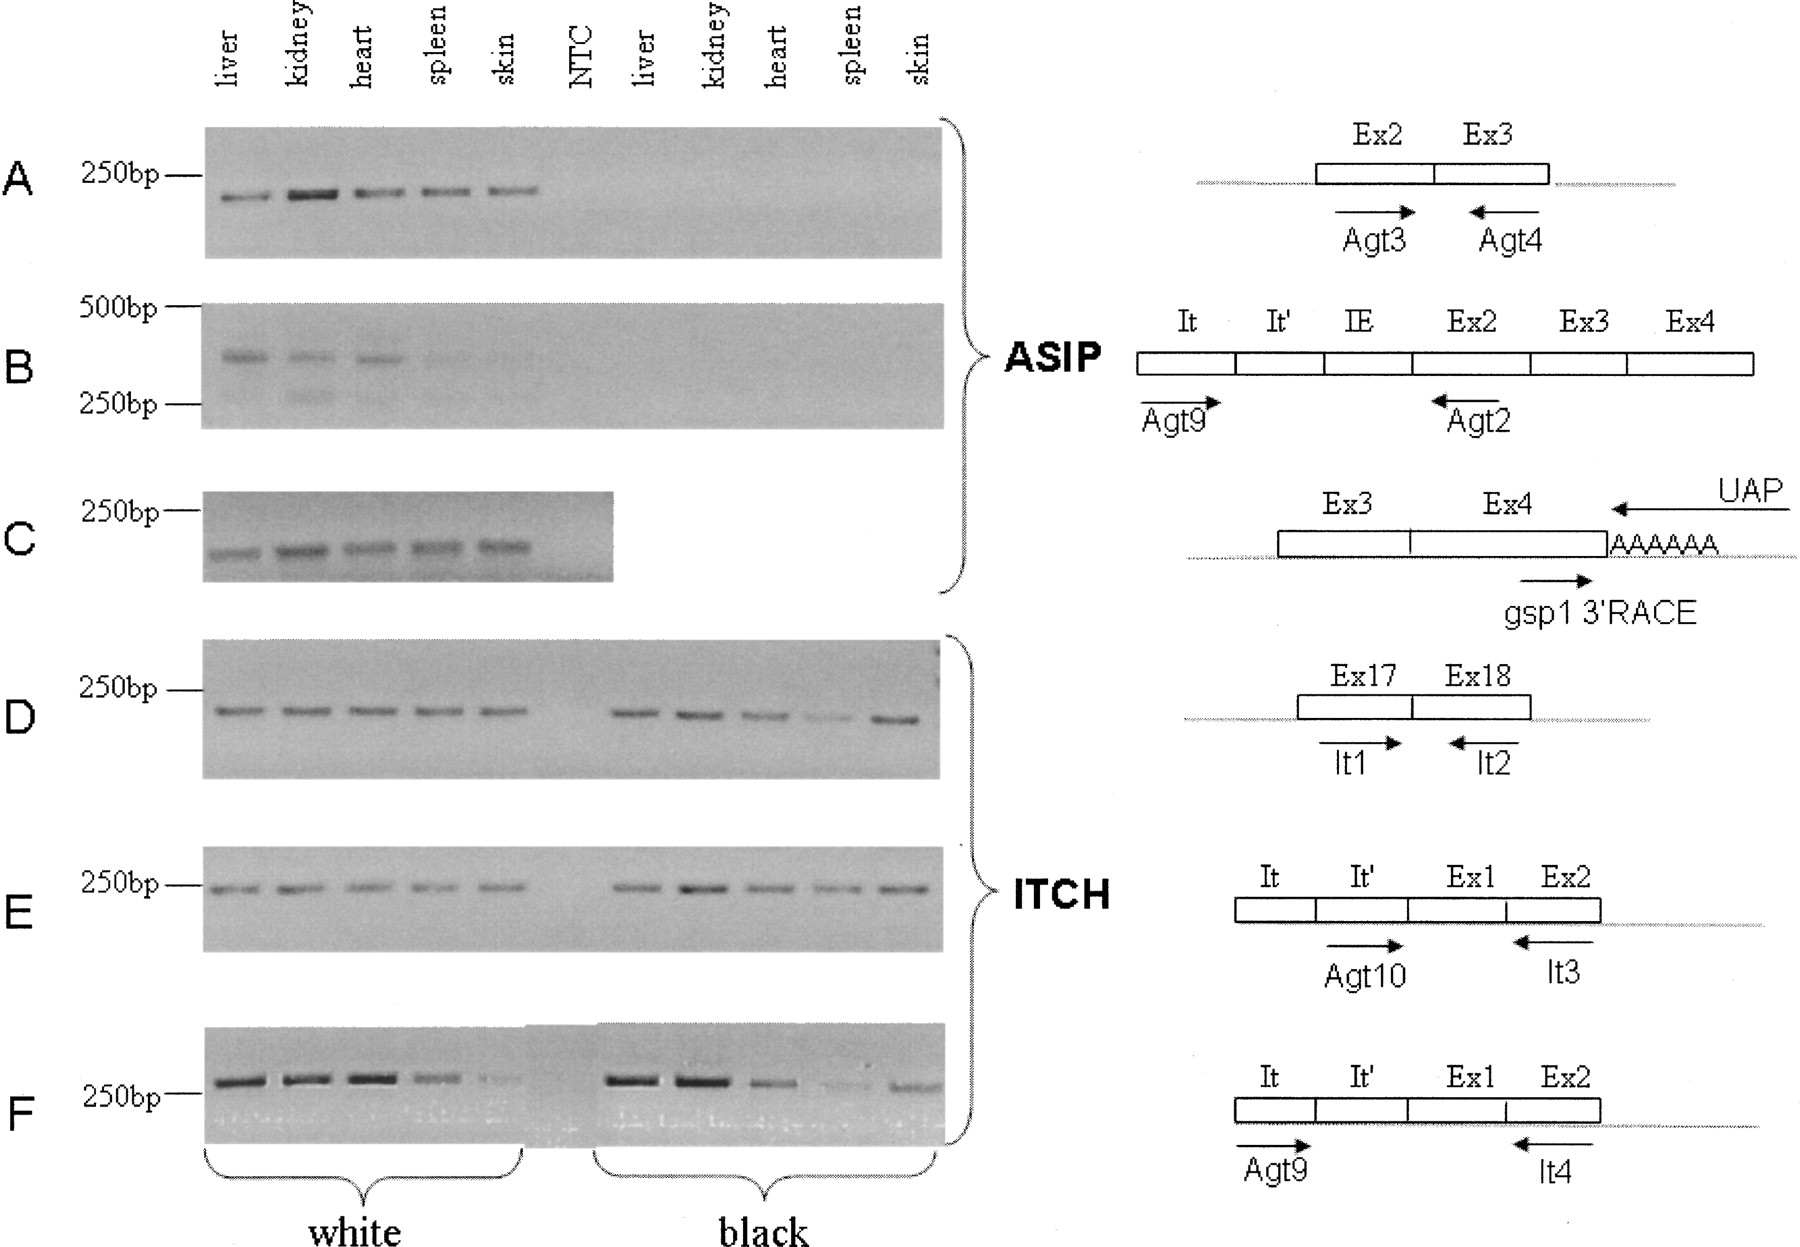
RT-PCR end-point gene expression analysis of ovine ASIP and ITCH in five tissues of a white and a self-color black Merino sheep. The position of primers used to amplify each product is shown in a schematic to the right of the corresponding 1.5% agarose gel image. It, It′, and IE are noncoding exons. Open boxes Ex2, Ex3 and Ex4 (A, B, and C) and open boxes Ex17, Ex18, Ex1, and Ex2 (D, E, and F) represent coding exons of the ASIP or ITCH genes, respectively. Other alternatively spliced transcripts of the agouti gene have also amplified as evident from the bands in panel B. The most abundant ASIP transcripts are those with exon IE (∼368 bp as shown in the panel B schematic). It and It′ were both present in ITCH transcripts and generated bands of the expected size (based on similarity to the bovine sequence), but no alternatively spliced forms were evident. 3′ RACE (panel C) showed ASIP transcripts in all tissues studied to have the same polyadenylation site.


