
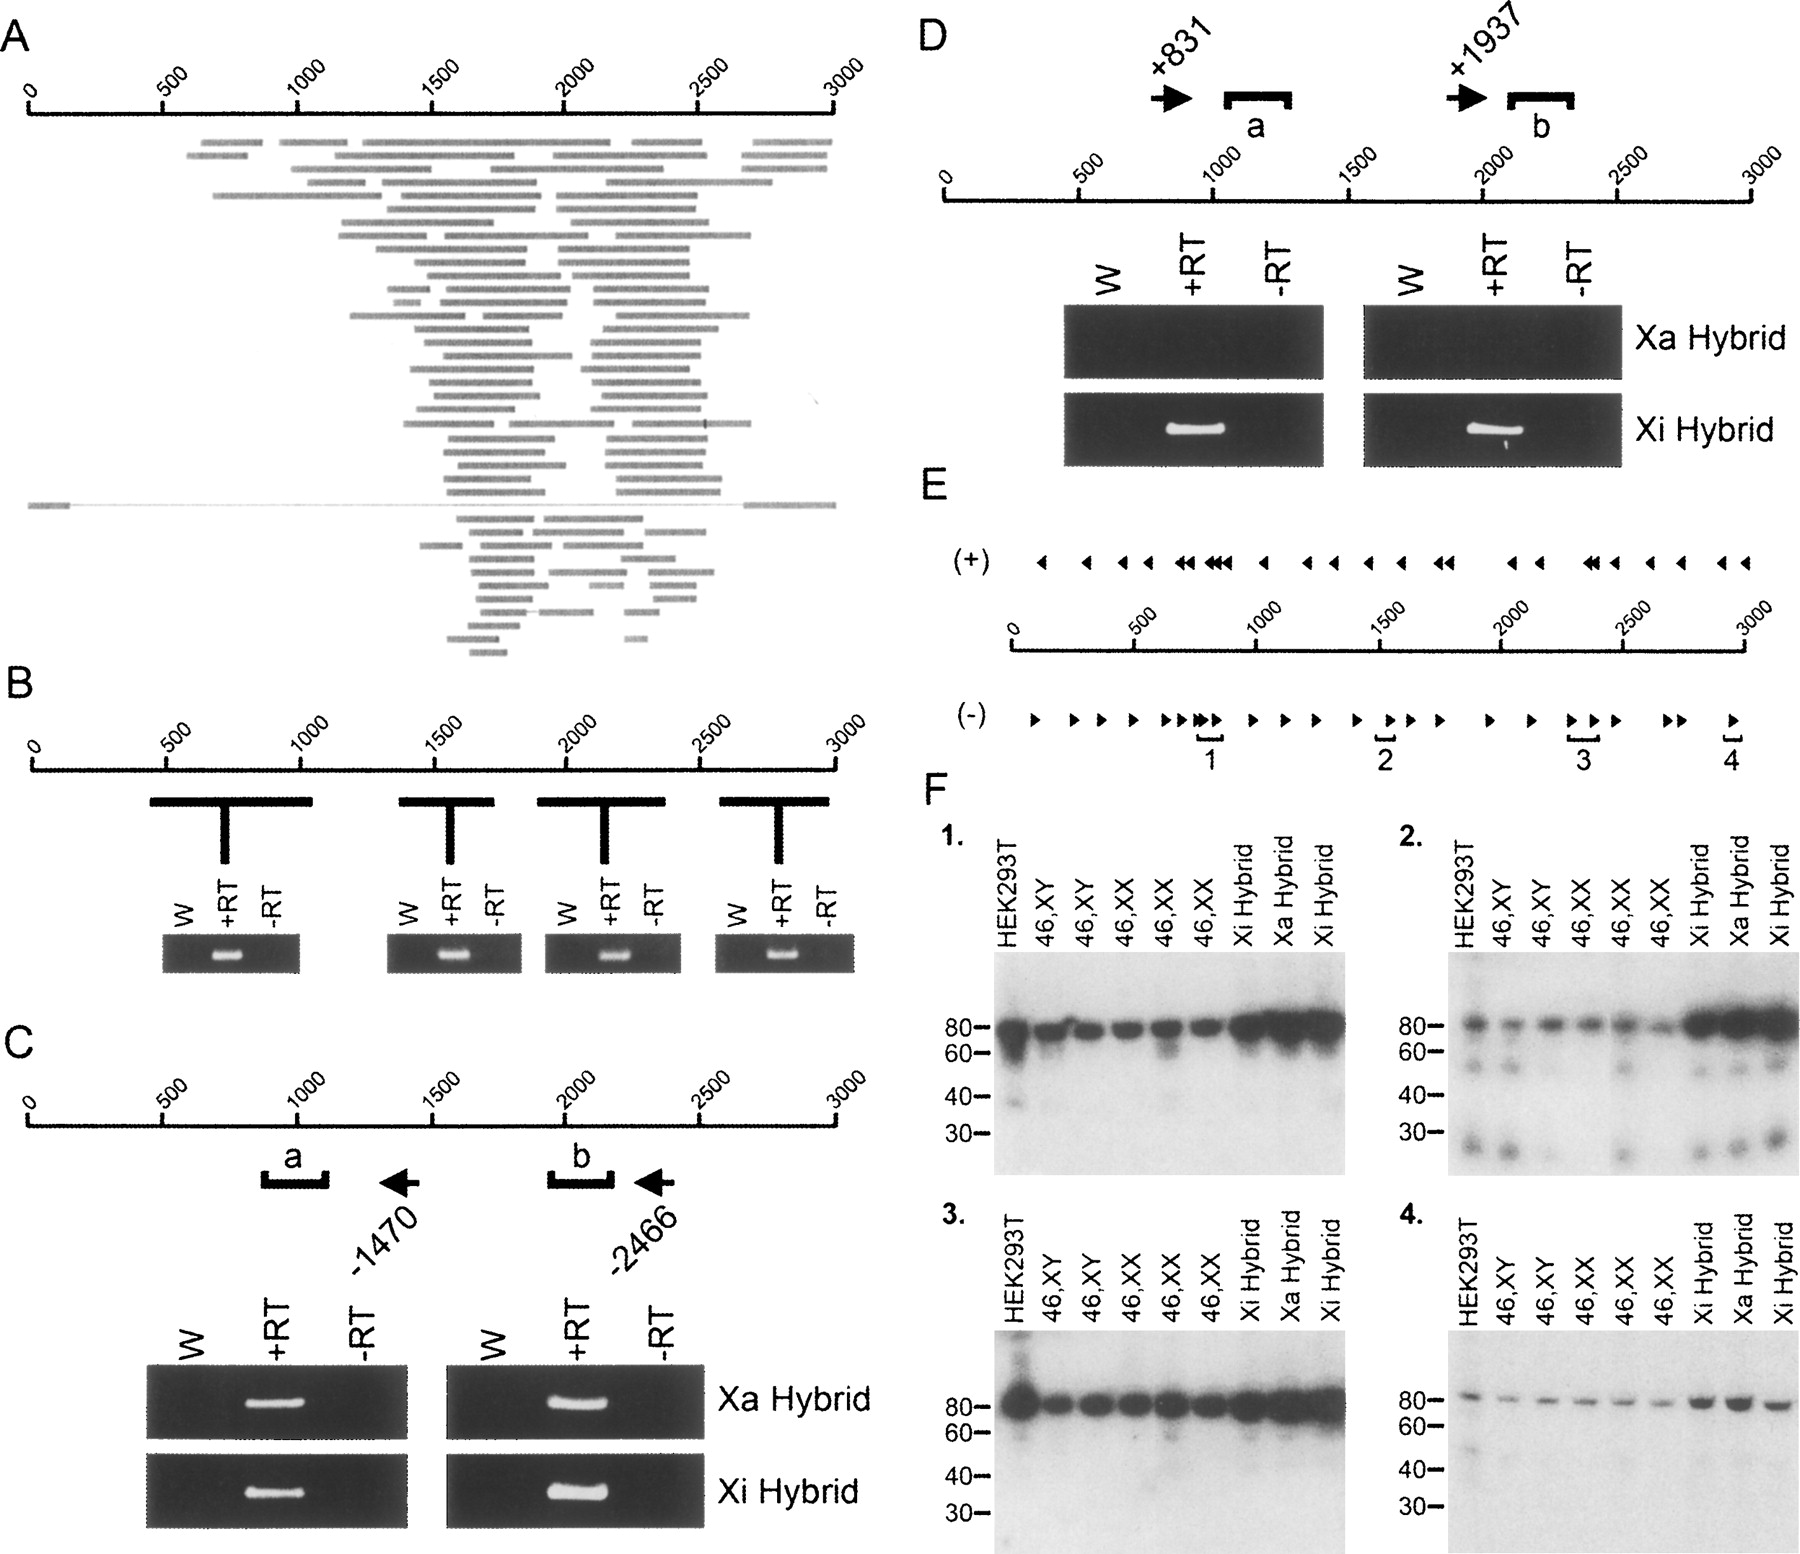
A long DXZ4 sense transcript and antisense small RNAs are common to the Xa and Xi arrays, whereas an antisense transcript is specific to the Xi. (A) Location of human ESTs with >94% sequence match to DXZ4. The scale of 1–3000 represents the 3-kb coordinates of a single DXZ4 monomer in bp. Horizontal gray bars represent individual EST matches. (B) A single 3-kb DXZ4 monomer is represented by a 1–3000 bp scale. Below the scale are the results of a selection of RT-PCR analyses on random-hexamer primed cDNA (i.e. strand-independent). The approximate region of DXZ4 PCR amplified is represented by the horizontal black lines. Each RT-PCR shows water control (W), with reverse transcriptase (+RT) and a no reverse transcriptase control (−RT). (C) Strand-specific RT-PCR analysis of DXZ4 RNA in Xa and Xi hybrids for the sense transcript. The 1–3000 bp scale represents a single 3-kb DXZ4 monomer. The location and starting coordinate of antisense or sense priming oligonucleotides are indicated by the left- and right-pointing arrows, respectively. PCR for each strand-specific RT reaction “a” (980–1221) and “b” (2106–2358) are indicated. Ethidium bromide gel images of water control (W), with reverse transcriptase (+RT) or without (−RT) are shown. (D) Strand-specific RT-PCR analysis of DXZ4 RNA in Xa and Xi hybrids for the antisense transcript. (E) The approximate location of 19–21 bp oligonucleotides hybridized to Northern blots are shown above and below DXZ4 for sense (+) and antisense (−) transcript detection, respectively. Small RNA hybridizing oligonucleotides are highlighted by regions 1–4. (F) Northern blots for oligonucleotides from regions 1–4. The size in bp is shown to the left. An example of an ethidium bromide stained polyacrylamide gel showing the small RNAs can be seen in Supplemental Figure 5A.


