
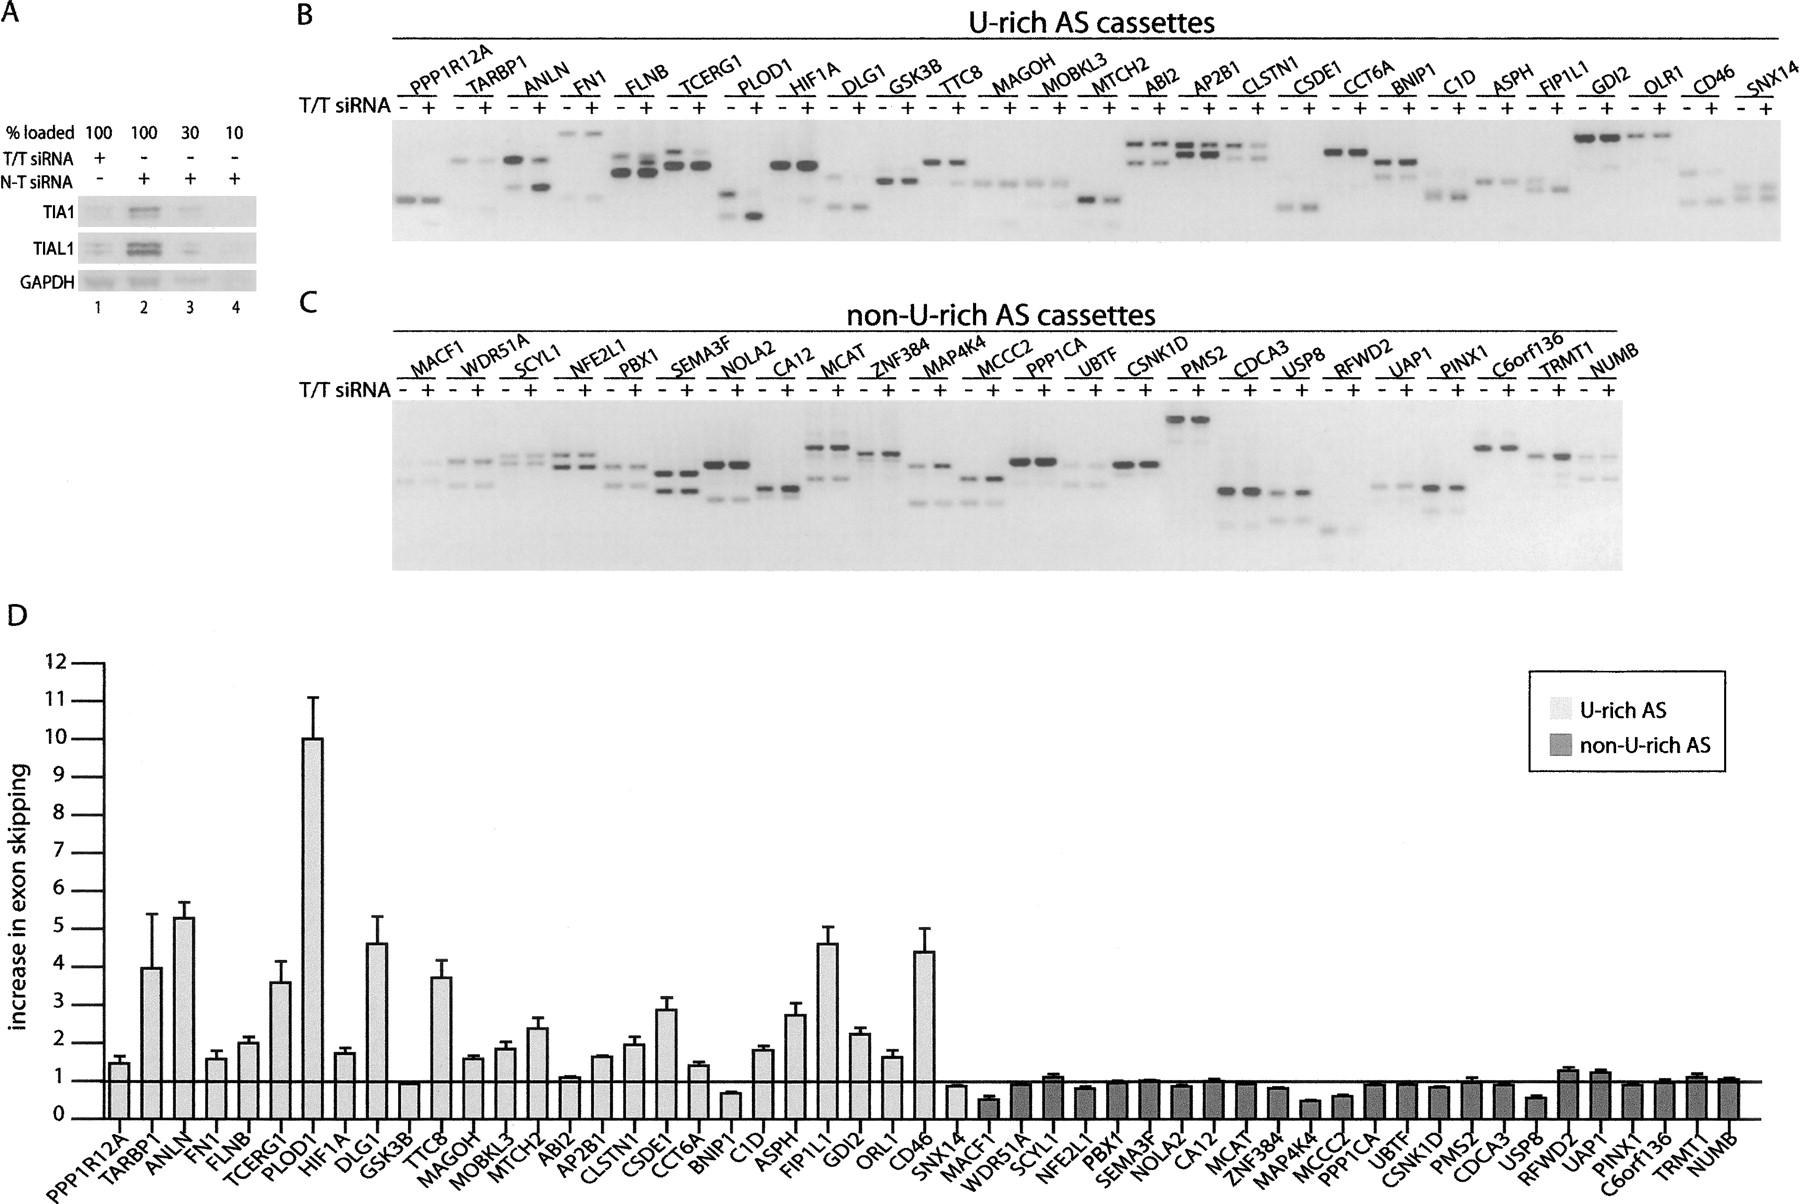
Alternative exons associated with U-rich downstream intronic sequences are differentially spliced following TIA1/TIAL1 depletion. (A) Immunoblot analysis of HeLa cells transfected with pools of siRNAs targeted against TIA1 and TIAL1 transcripts (lane 1), or transfected with a pool of control, nontargeting siRNAs (lanes 2–4). The upper panel was probed with an anti-TIA1 antibody, the middle panel with an anti-TIAL1 antibody, and the bottom panel with an anti-GAPDH antibody. The anti-TIA1/TIAL1 antibodies each detect a protein doublet, presumably corresponding to variants of these proteins. Lanes 3 and 4 are dilutions corresponding to 30% and 10%, respectively, of the sample loaded in lane 2. (B) RT-PCR analysis of alternative spliced exons associated with U-rich intronic sequences in HeLa cells transfected with either a pool of control nontargeting siRNAs (−) or pools of siRNAs specific to TIA1/TIAL1 (+). (C) RT-PCR analysis of alternative spliced exons associated with non-U-rich introns in HeLa cells transfected with either a pool of control, nontargeting siRNAs (−) or a pool of siRNAs specific to TIA1/TIAL1 (+). (D) Densitometric analyses of the resulting PCR bands were carried out using ImageQuant software. The increase in exon skipping upon TIA1/TIAL1 depletion was calculated as the ratio of the band intensities of exon-included (−)/exon-excluded (−) over the band intensities of exon-included (+)/exon-excluded (+). A ratio equal to 1, as shown by the horizontal line, indicates no change in the level of exon skipping upon TIA1/TIAL1 depletion. The means and standard errors of the ratios from two independent RT-PCR analyses of two independent siRNA transfection experiments were calculated for each alternatively spliced cassette exon and plotted using GraphPad Prism 4. Light gray bars correspond to U-rich alternatively spliced cassettes; dark gray bars correspond to non-U-rich AS cassettes. T/T siRNA indicates TIA1/TIAL1 siRNA; N-T siRNA, nontargeting (control) siRNA.


