
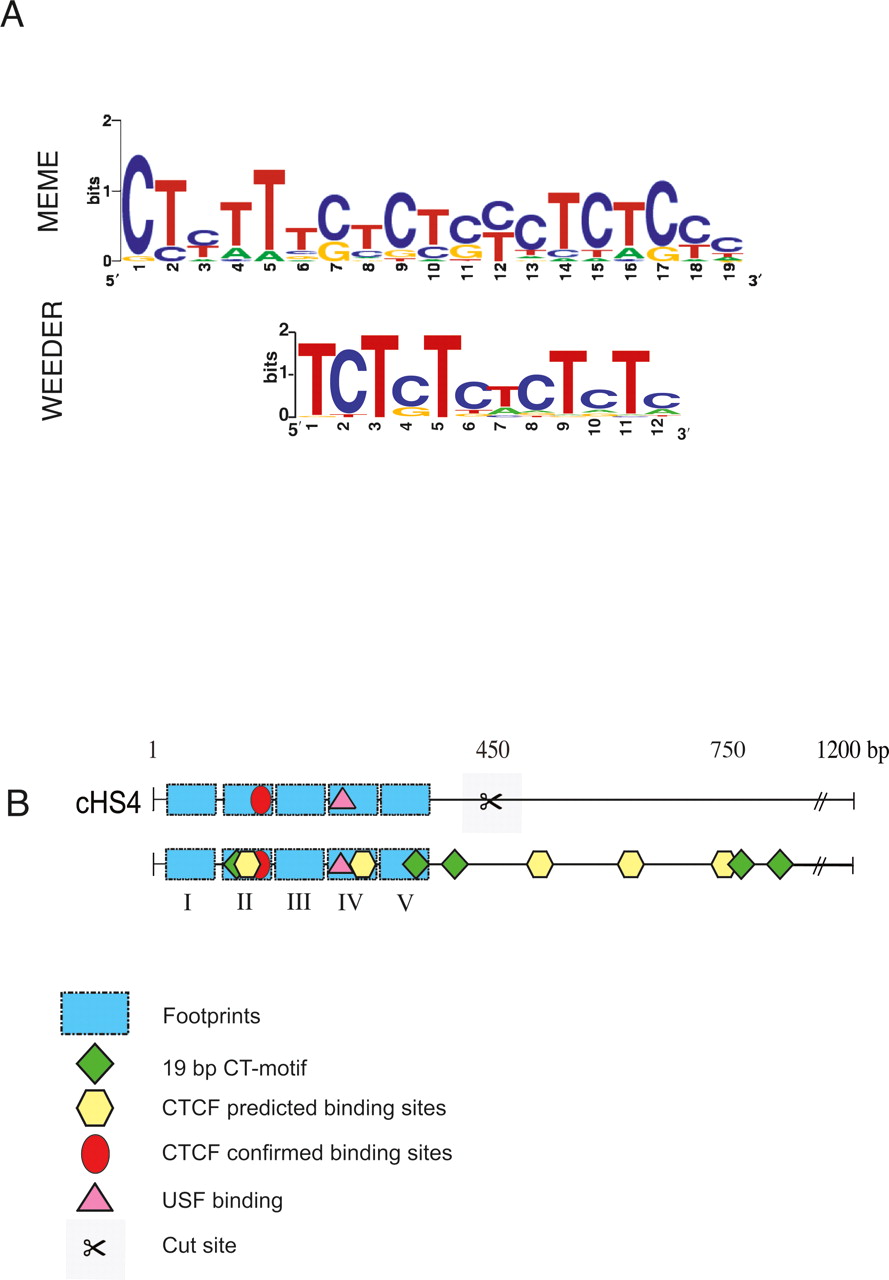
Bioinformatic analyses of silencer sequences. (A) The sequence motif(s) identified in eight strong silencer regions from chromosome 7 and the cHS4 insulator element. The upper motif is detected using the MEME program and the lower motif is from the Weeder program. (B) Motifs detected in the 1.2-kb cHS4 insulator sequence. The upper panel represents functional annotations prior to our analysis. The lower panel implicates novel functional regions as a result of our analysis. Blue rectangles depict the five published footprint regions, green diamonds illustrate positions of the 19-bp CT-motifs, yellow hexagons correspond to newly predicted CTCF binding sites, the red circle denotes one characterized CTCF site, and the pink triangle represents a verified USF binding site. CTCF sites that intersect the 19-bp CT-motif (yellow and green icons, respectively) are within footprint region FII and at the position marked at 750 bp. The scissors indicate the site of the truncation analysis presented in Figure 2.


