
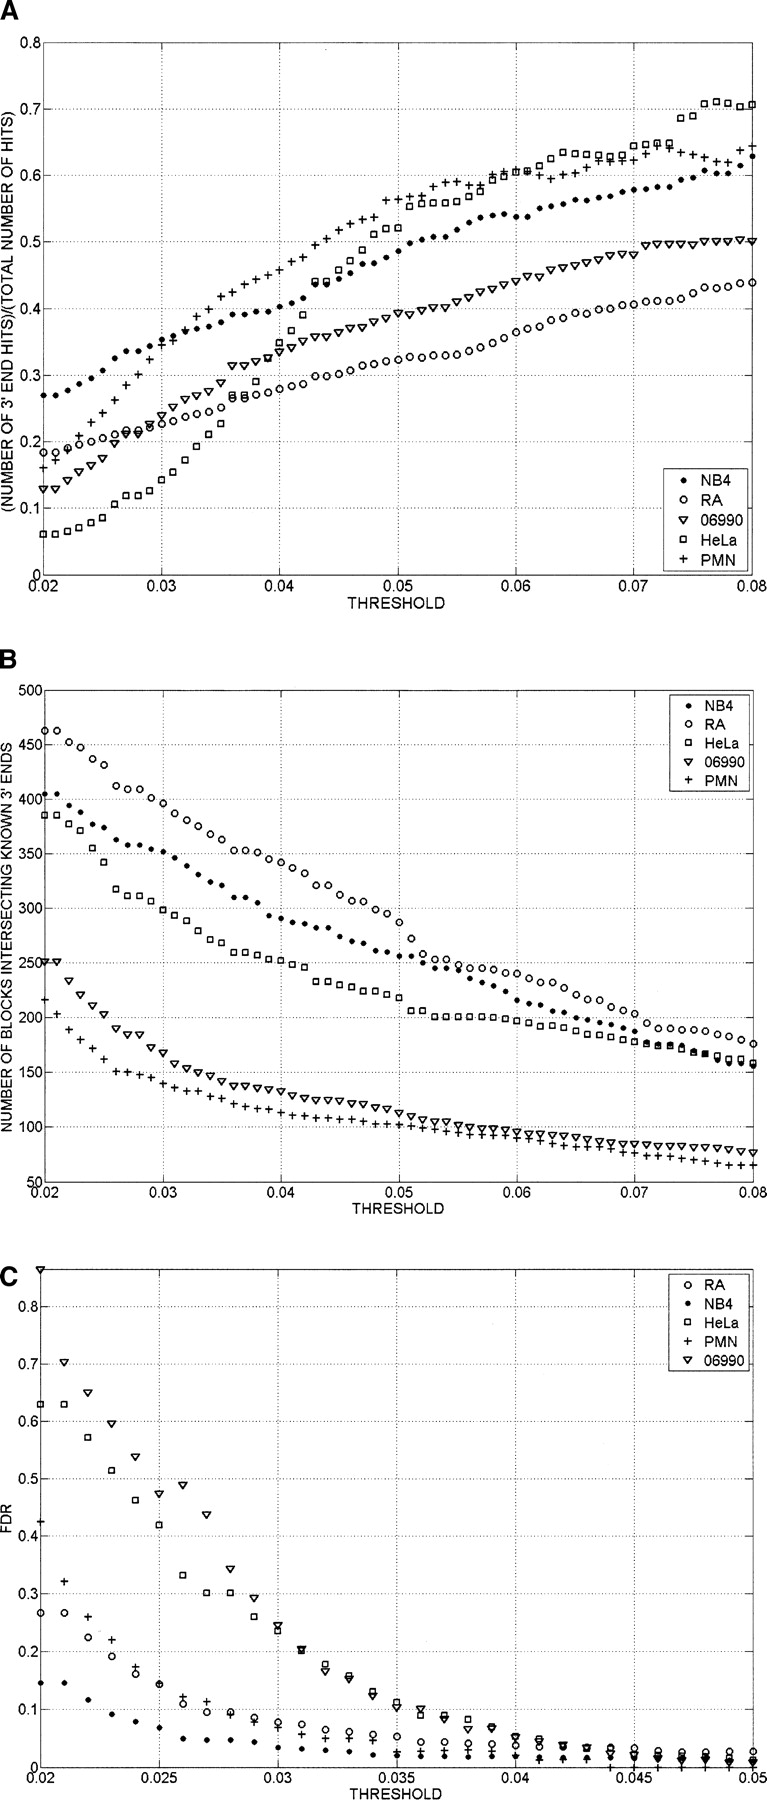
(A) Ratio of 3′ end signals for annotated genes to total 3′ end signals as a function of the threshold value used to call 3′ ends. After quantile normalization, data from replicates were combined by averaging the signals of the replicates. Signal intensity yi = log(Ri) − log(Gi) was assigned to each probe, where log(Ri) and log(Gi) are Cy5 and Cy3 channels’ intensities after the aforementioned transformations were performed. Contiguous segments (bars) due to the signal coming from the enriched regions were obtained by joining probes with intensities yi above the threshold separated by less than a certain distance (max-gap of 114 bp). Only segments whose length was greater than a particular size (min-run of 114 bp) were selected. As the threshold for calling a positive signal was lowered, a greater fraction of the calls were from regions not adjacent to the 3′ ends of known genes. Results are shown for five cell types. GENCODE annotation was used for the analysis. (B) Total number of 3′ end signals associated with annotated genes as a function of threshold. Signals are considered as intersecting a known 3′ end if they lie within 2500 bases downstream from the known end. Signals were calculated as in A. The number of signals associated with known genes increased throughout the range as thresholds were lowered. Results are shown for five cell types. 06990 and PMN are end stage differentiated cells (a lymphoblastoid cell and a normal neutrophil); therefore, it is not surprising to see that a smaller number of 3′ ends are present in these cell lines. GENCODE annotation was used for the analysis. (C) False-discovery rate (FDR) as a function of the threshold used to call 3′ ends. Results are shown for five cell types. For each data set the genomic locations of the probes on the microarray were randomly shuffled. The max-gap and min-run procedures described in “Bioinformatic Analysis” section were applied to the randomized data. The FDR was computed as FDR(threshold) = N1(threshold)/N2(threshold), where N1 is the number of discovered blocks for the randomized data and N2 is the number of blocks for the nonrandomized data. FDR increases as the threshold for calling a positive signal decreases.


