
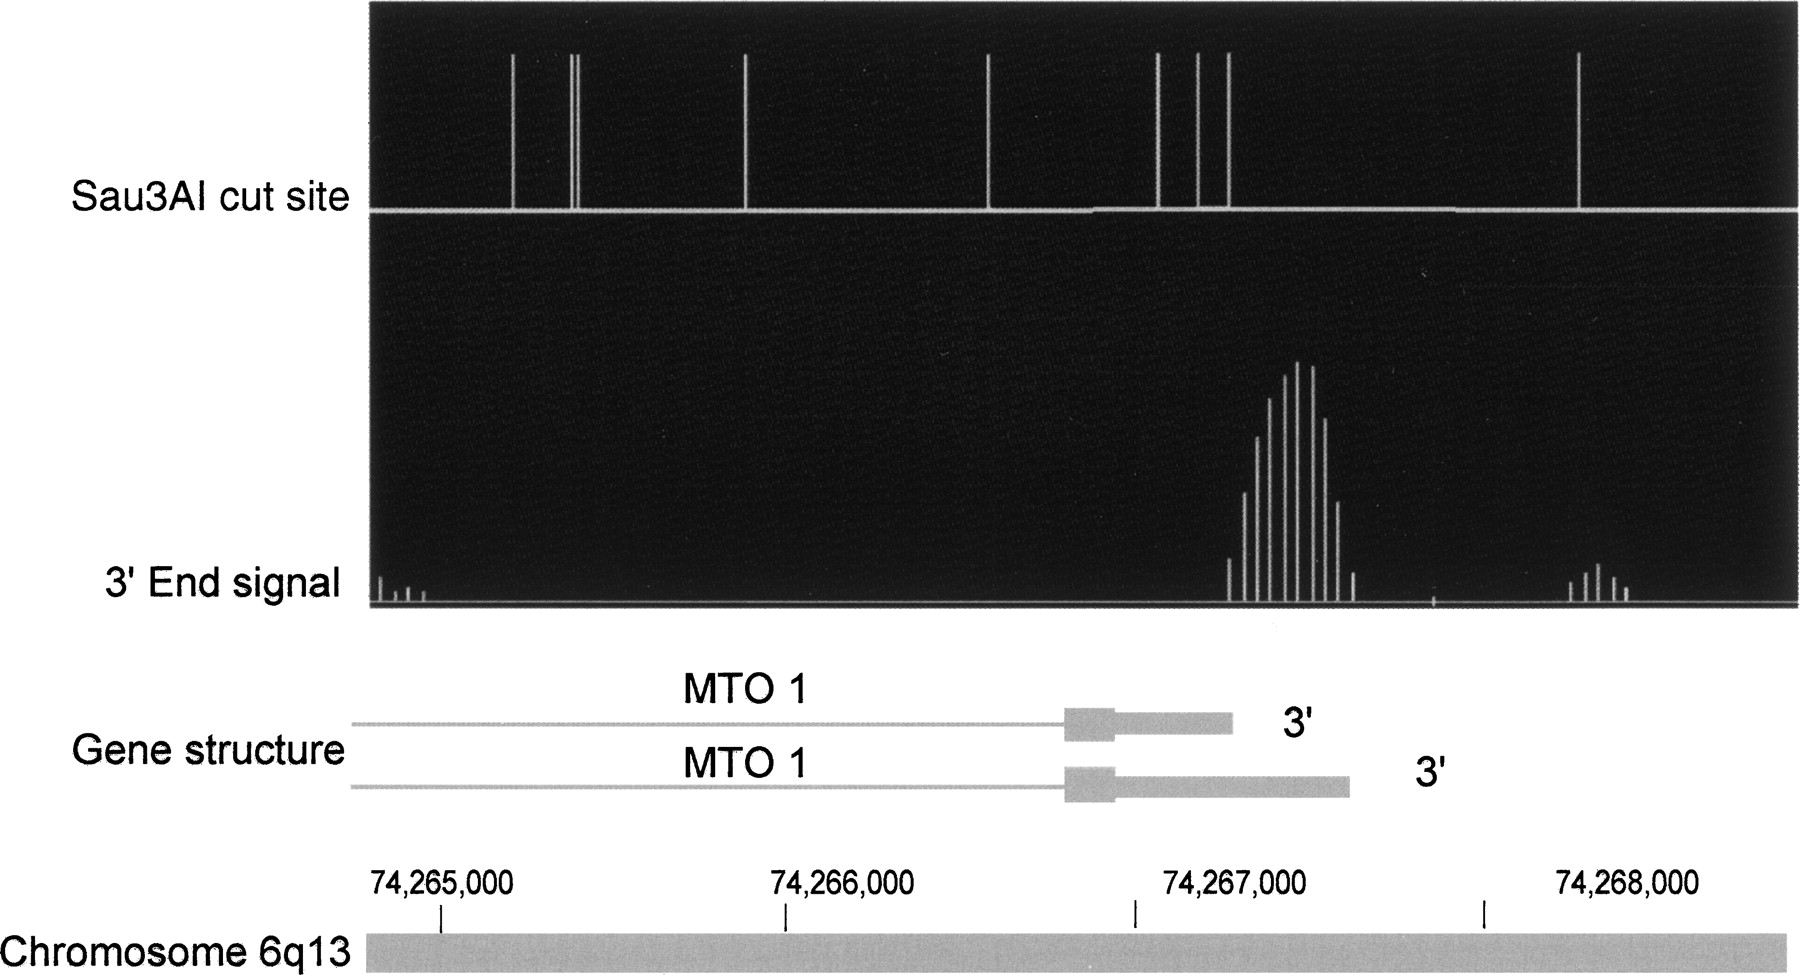
Example of poly(A) signal. Vertical lines in the top portion of the figure correspond to Sau3AI recognition sites in genomic DNA. Closely spaced vertical lines in the second row represent the normalized signals comparing 3′ end fragments to total cDNA. The lower horizontal line represents the 3′ end of the MTO1 gene. Thick bars are exons and thin lines are introns. The figure shows that the orientation of the transcript can be distinguished because the signal begins at a Sau3AI cutting site and extends part way toward the next cutting site. This shows that the major 3′ end of the MTO1 transcript in these HeLa cells is coincident with the shorter 3′ end in the literature, with a very weak second signal corresponding to the longer 3′ end. Note that computer smoothing of data causes some signal spread upstream of the cutting site.


