
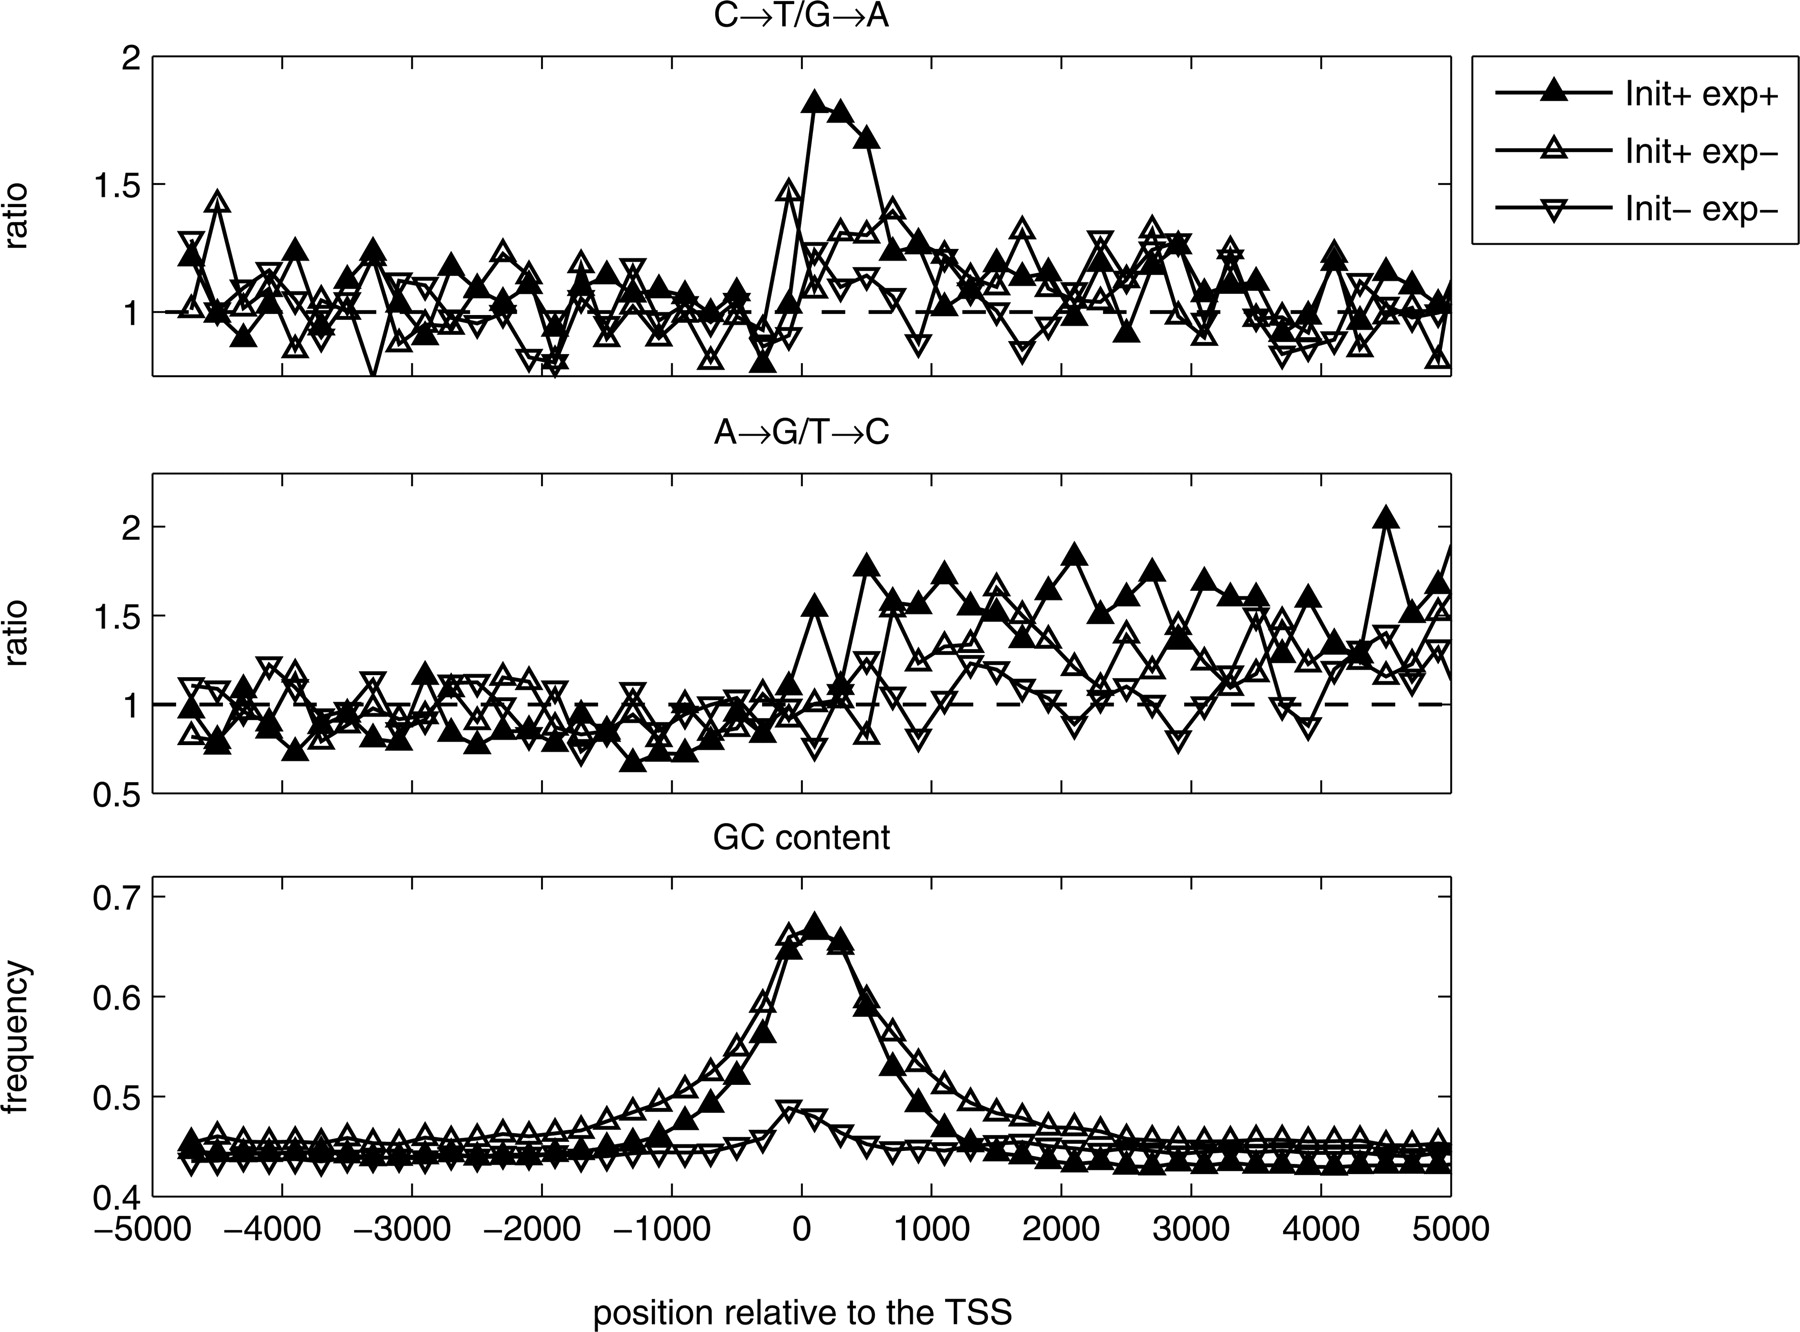
Correlation between strand asymmetry and transcription status of genes in embryonic stem cells (ESC). The ratios between complementary transition rates and the GC content are calculated in three gene classes (Guenther et al. 2007): genes that experienced initiation and transcription (exp+init+); genes that experienced initiation but not complete transcription (exp−init+); genes that experienced initiation but not complete transcription (exp−init−). The length and the nucleotides’ composition properties of the sequences that were used for substitution estimation in each window are presented in Supplemental Figure S16. The estimation of substitution frequencies has been performed using the nontemplate strand.


