
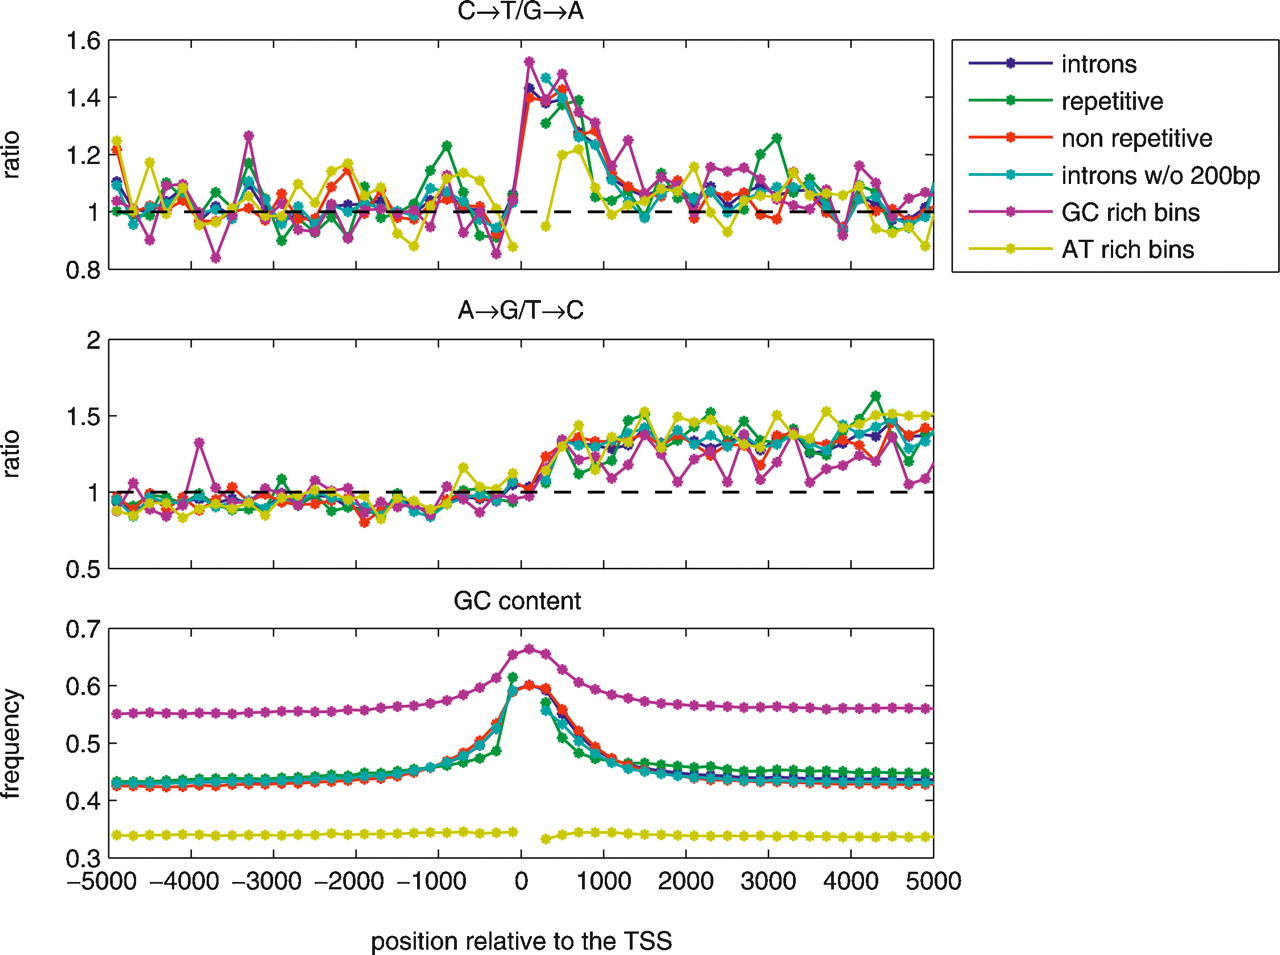
Figure 3.
Ratios between complementary transition rates and the GC content plotted against distance from the 5′ end of genes calculated in 200-bp-long windows along the nontemplate strand, combined with information from all genes and presented by six different genomic contexts. (Intronic) Genes that were used in Figure 2; (introns w/o 200bp) the 200 bp in introns’ edges were excluded; (GC-rich windows and AT-rich windows) DNA sequences with GC content of >50% and <41%, respectively. Windows that contained less than 100 kbp-long DNA sequences were omitted (see Supplemental Fig. S15 for the amount of sequence in each window).


