
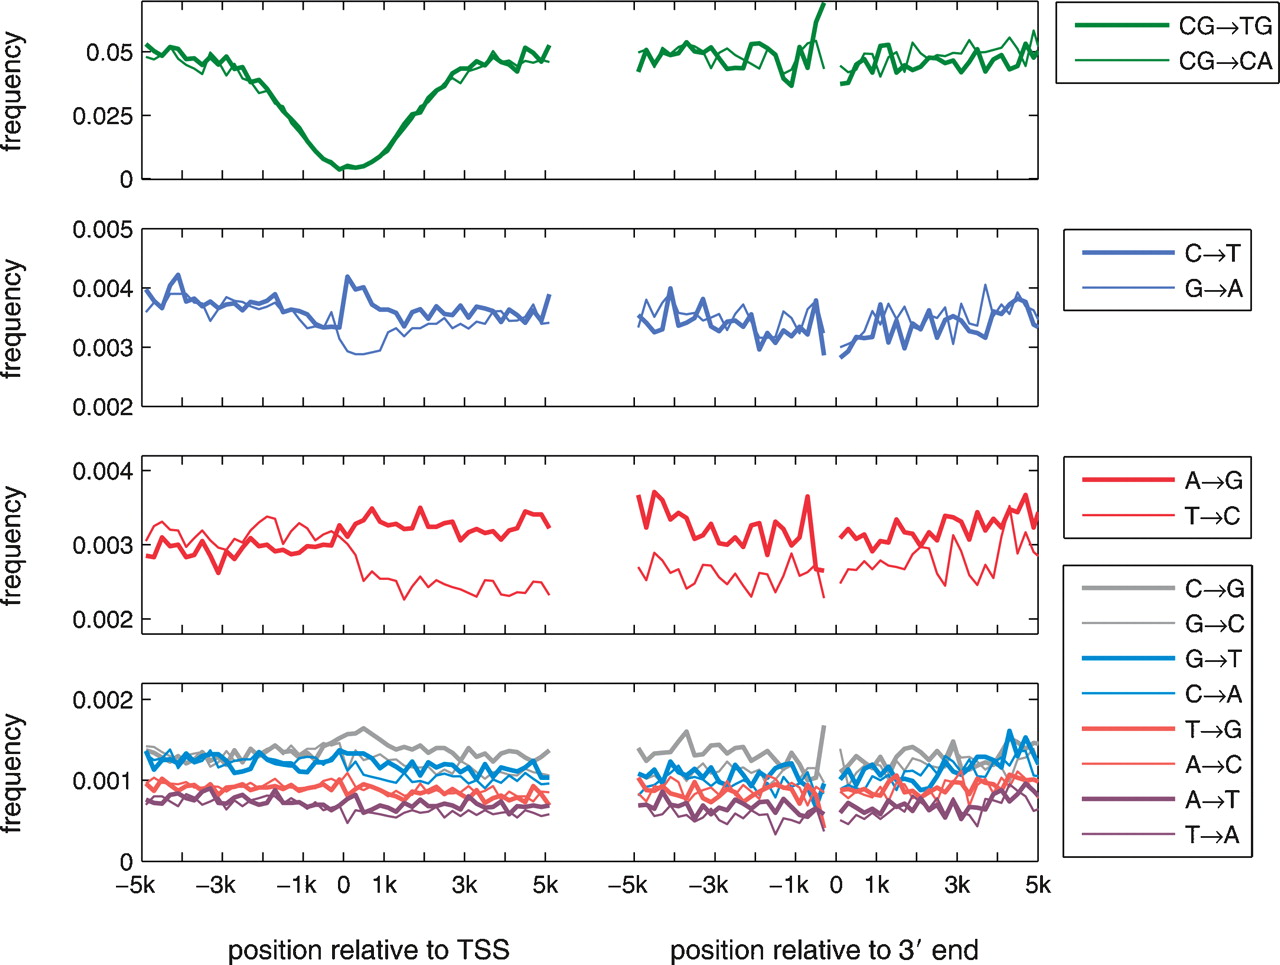
Figure 2.
Substitution rates in introns and in intergenic regions in the vicinity of 5′ and 3′ ends of human genes. The plots show the estimated 12 single-nucleotide substitution rates and the CpG deamination rates in nonoverlapping 200-bp-long windows along the nontemplate strand. The distances of the windows’ centers from the 5′ or 3′ end are indicated on the X-axes. The estimation of substitution frequencies has been performed using the nontemplate strand.


