
Figure 1.
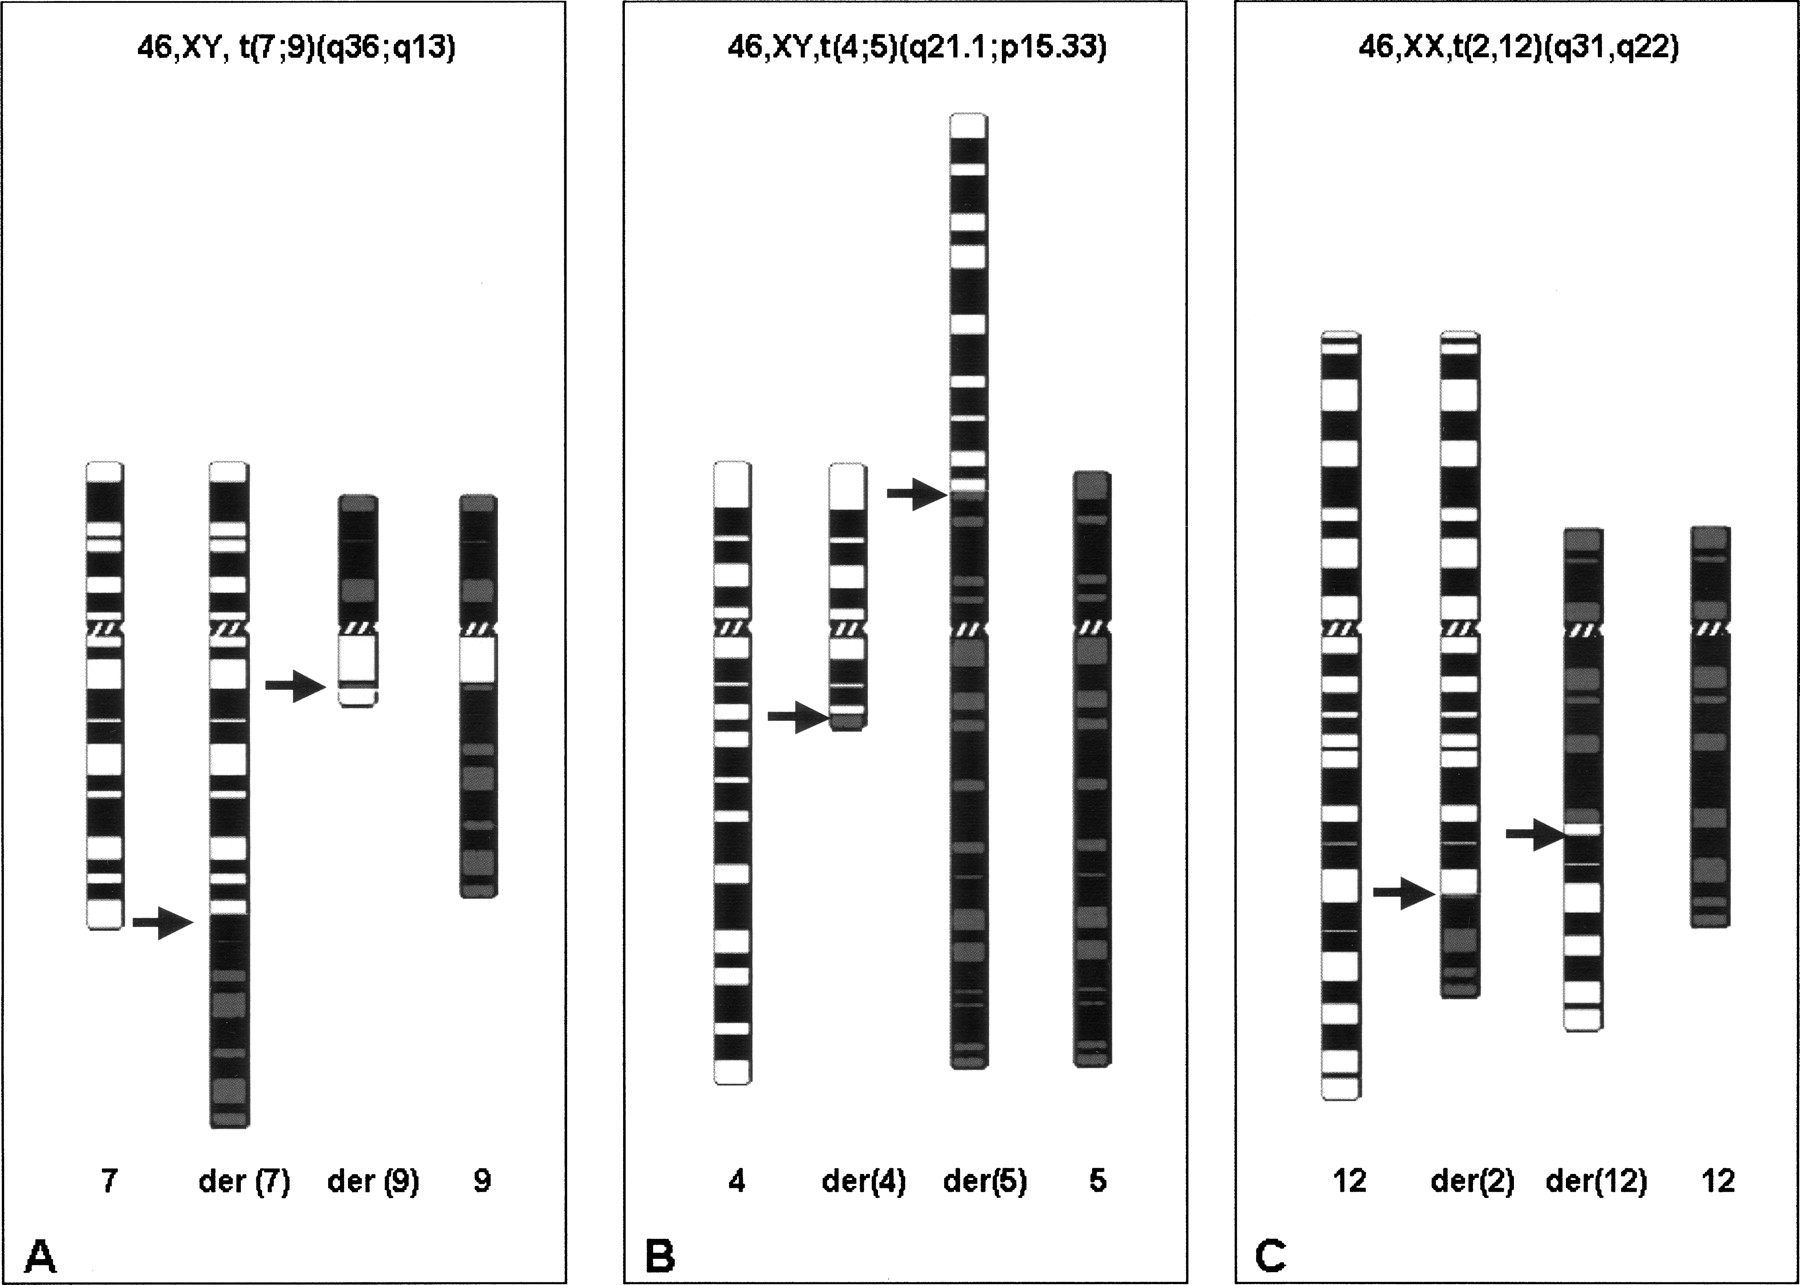
Ideograms of the derivative chromosomes from the patients. (A) Patient 1, (B) patient 2, (C) patient 3. (Arrows) Breakpoints.
(Downloading may take up to 30 seconds. If the slide opens in your browser, select File -> Save As to save it.)
Click on image to view larger version.
Ideograms of the derivative chromosomes from the patients. (A) Patient 1, (B) patient 2, (C) patient 3. (Arrows) Breakpoints.
 CiteULike
 Delicious
 Digg
Digg Facebook
 Google+
 Reddit
 Twitter
