
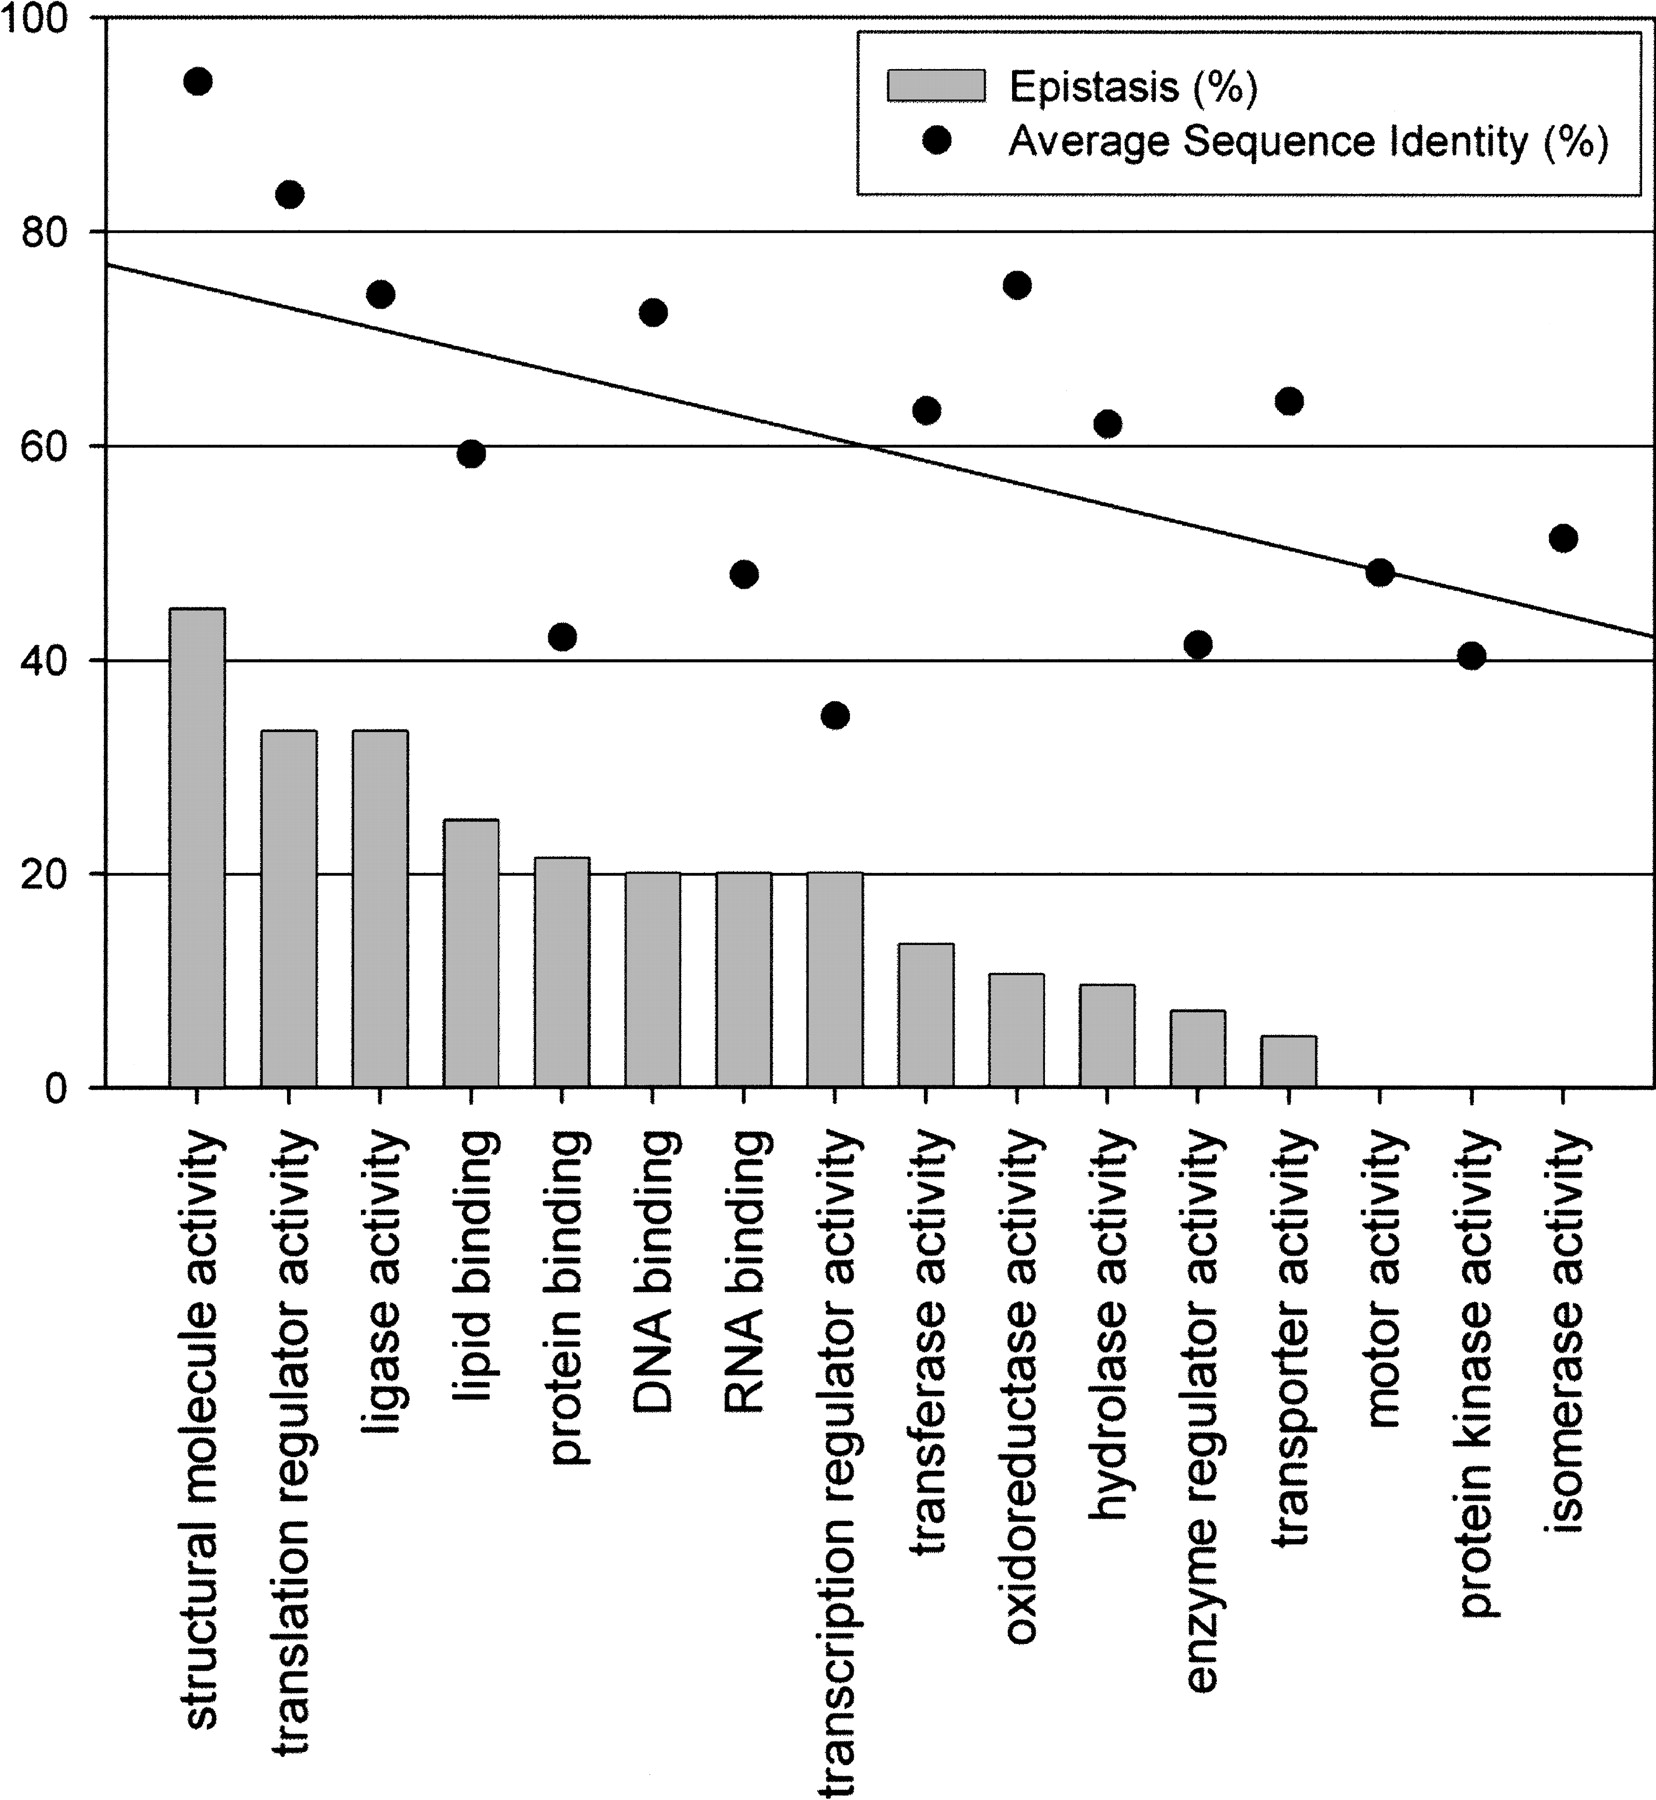
Buffering paralogs by GO slim annotation. WGD paralogs were grouped into functional categories based on the broad definitions of the GO slim hierarchy and ranked in decreasing order based on the percentage of paralogs found to be buffering (IG), indicated with bars. Only those paralog pairs with single, matching annotations were included, resulting in 315 depicted pairs (categories “other” and “molecular function” were removed). The juxtaposed dot plot indicates the average percent sequence identity of functional groups (buffering and non-buffering paralogs combined); the overlaid line indicates linear regression. There is a significant correlation (r = 0.64, P < 0.005) between the epistatic capacity of a functional group and the co-conservation of paralogs contained therein.


