
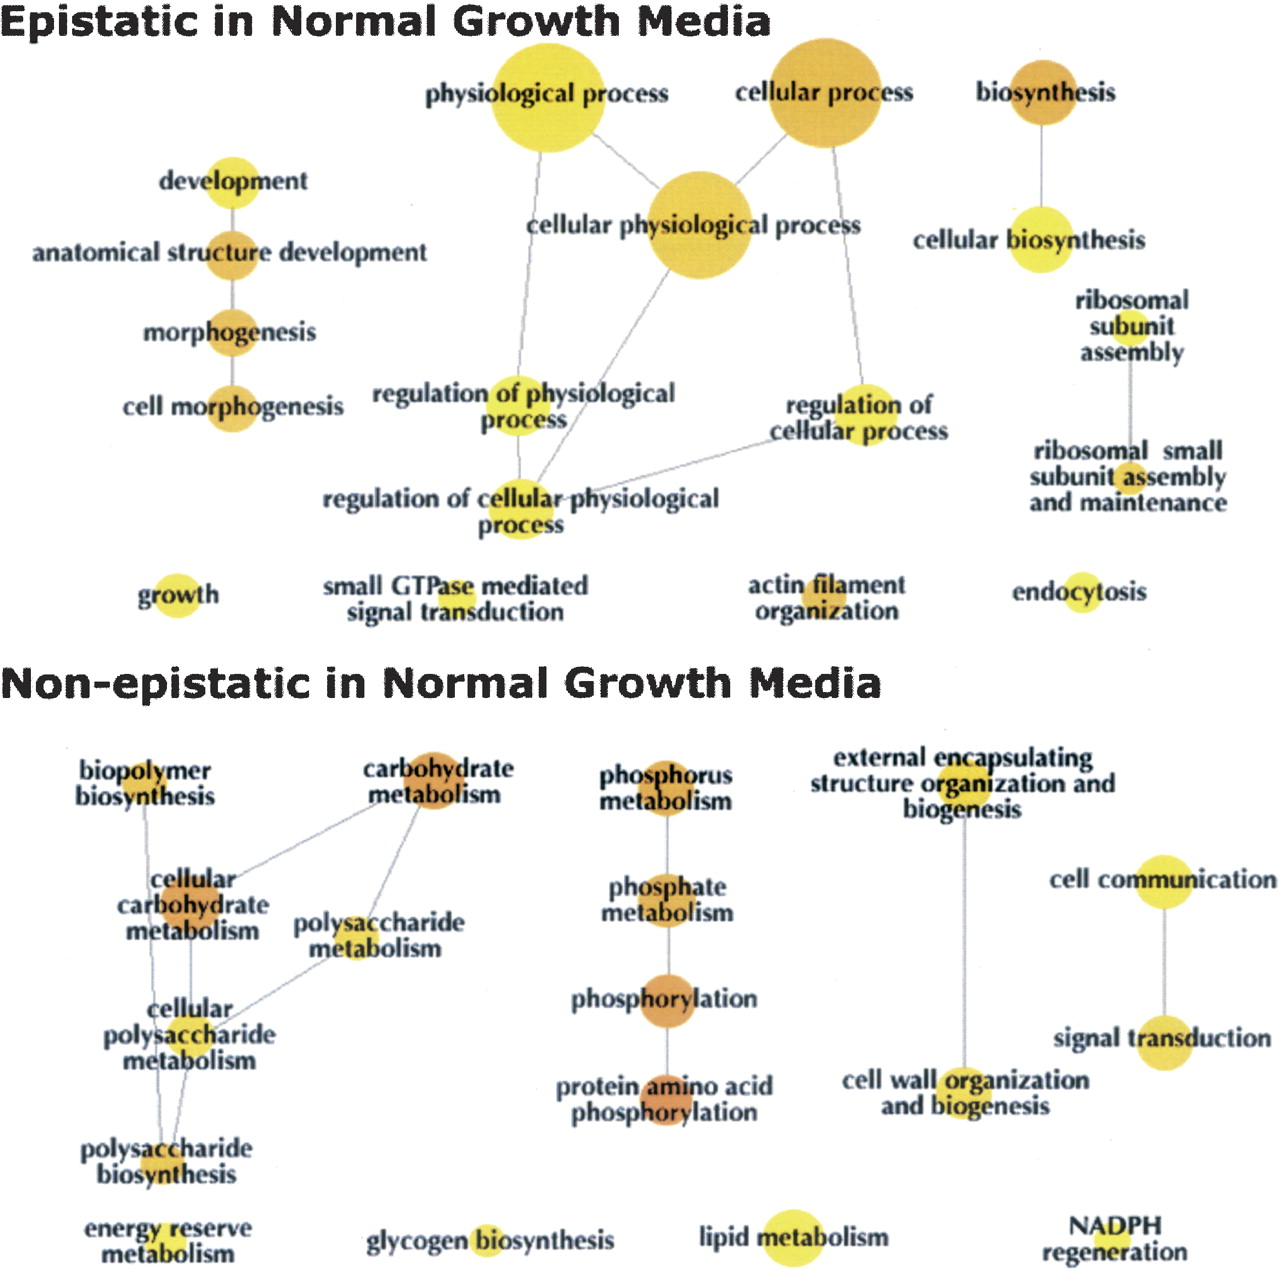
GO representation of epistasis under normal growth conditions. Depicted are the GO functional categories over-represented for paralogs both epistatic (above) and non-epistatic (below) under normal growth conditions (i.e., those detected by either RSA or GCA, the union group). The size of the node reflects the fraction of paralogs involved in that over-represented process, and darker coloring denotes higher significance. While the significance of each term was calculated independently (regardless of placement within the GO classification system), lines indicate continuance along the path of the GO directed acyclic graph. Increased statistical stringency (P < 0.0005) was used for depicted terms in order to account for increased representation of more general terms. The picture was created using the BinGO Cytoscape plug-in.


