
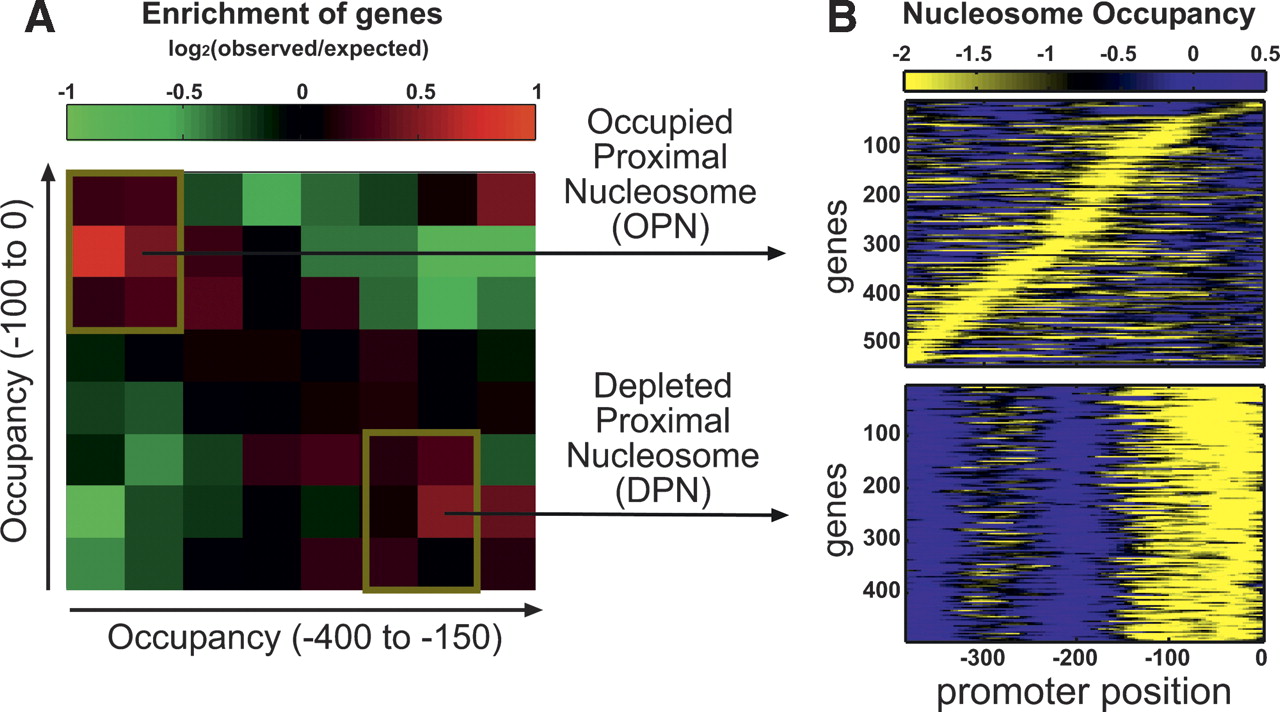
Two patterns of nucleosome occupancy. (A) The pattern of nucleosome occupancy at each promoter was summarized by two values: the average occupancy at −100 to 0 (proximal region), and that at −400 to −150 (distal region). For each of these values, the genes were sorted and divided into eight equal bins. We examined the number of genes in each combination of bins for the two values and compared it with the expected number if the two values were independent. Colors specify the log2 of the ratio between the observed and expected number of genes in each combination of bins: (red) positive values (enrichment), (green) negative values (depletion). (B) Two classes were defined based on their enrichment: low occupancy at the proximal region and high occupancy at the distal region (DPN), and high occupancy at the proximal region and low occupancy at the distal region (OPN).


