
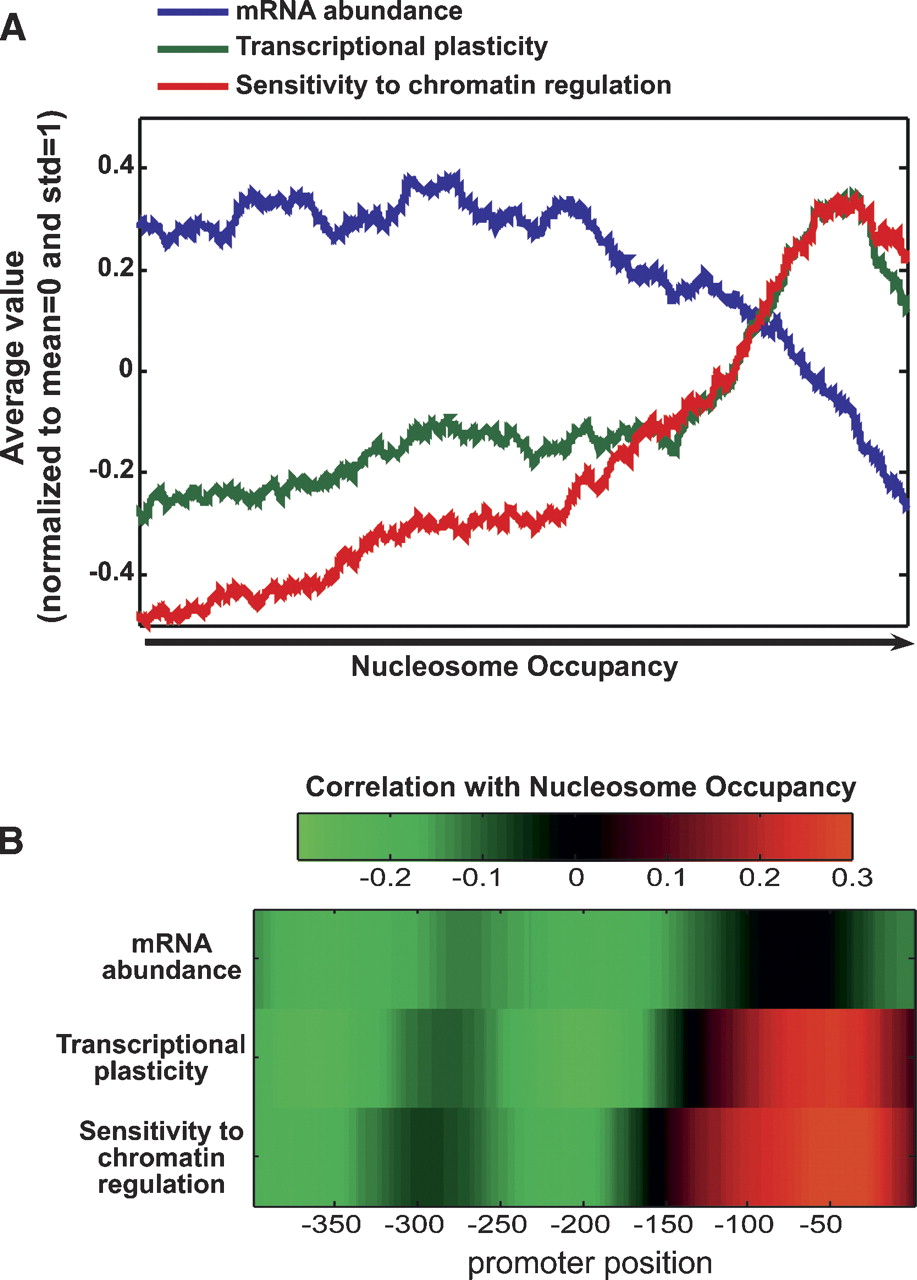
Correlation between nucleosome occupancy and transcription regulation. Nucleosome occupancy was compared with three aspects of transcription regulation: mRNA abundance (blue), transcriptional plasticity (average of the squared log2 expression ratio) to a range of perturbation (green), and sensitivity to chromatin regulation (red). These three measures were normalized by subtracting their means and dividing by their standard deviations. (A) Genes were ordered by their average occupancy at the 150 bp upstream of the TSS, and a sliding window (window size of 500 genes) is shown for the three measures of transcription regulation. (B) Correlations between nucleosome occupancy at each position (from −400 to 0, relative to the TSS) and the three measures of transcription regulation.


