
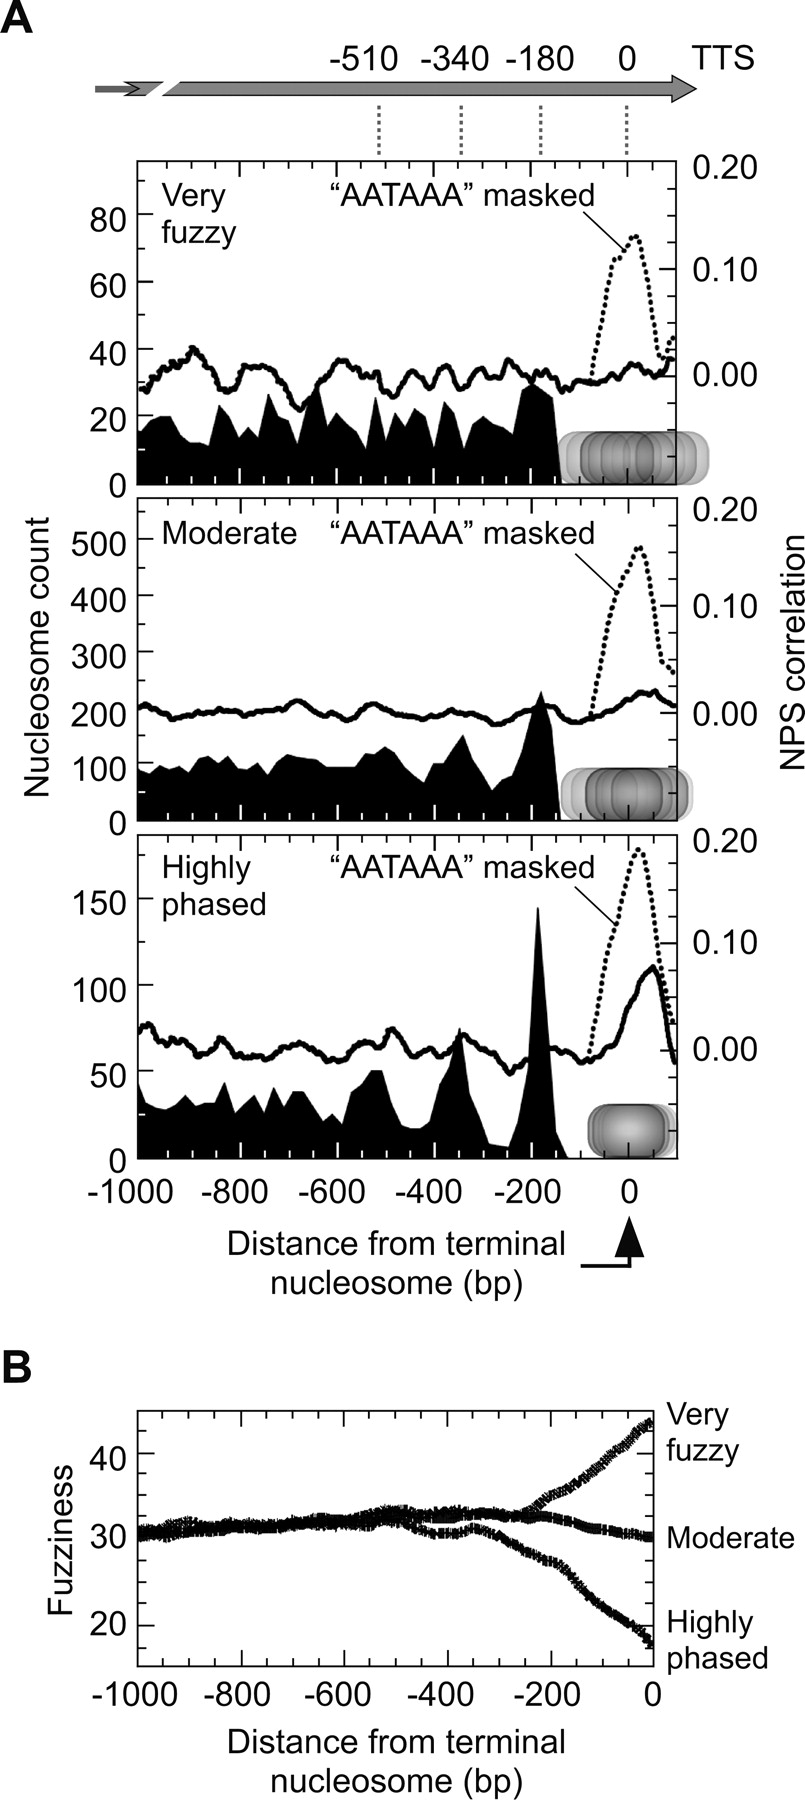
Statistical positioning emanating from positioned terminal nucleosomes. (A) Distribution of nucleosomes upstream of the terminal nucleosome. The terminal nucleosome was defined as the closest upstream nucleosome to the transcript termination site (TTS) (David et al. 2006) for transcripts of at least 1.3 kb. Terminal nucleosomes that were within 500 bp of the TTS and defined by >6 reads (to achieve a statistically robust fuzziness value) were divided into three groups based upon percent rank of fuzziness (<15%, highly phased; 15%–85%, moderate; >85%, very fuzzy). Upstream nucleosomes were binned based upon distance from the terminal nucleosome. Bin counts (left axis) were not normalized to the number of genes analyzed. NPS correlation plots for the same set of genes aligned by the terminal nucleosome are shown as solid traces (right axis). Dashed traces have AATAAA (and related sequences) masked, as described in the Methods. (B) Sliding window analysis of average nucleosome fuzziness as a function of distance from the terminal nucleosome. The low fuzziness around the penultimate nucleosome (from 150 to 250 bp upstream of the terminal nucleosome) was significant at 1 SD but not at 2 SD.


