
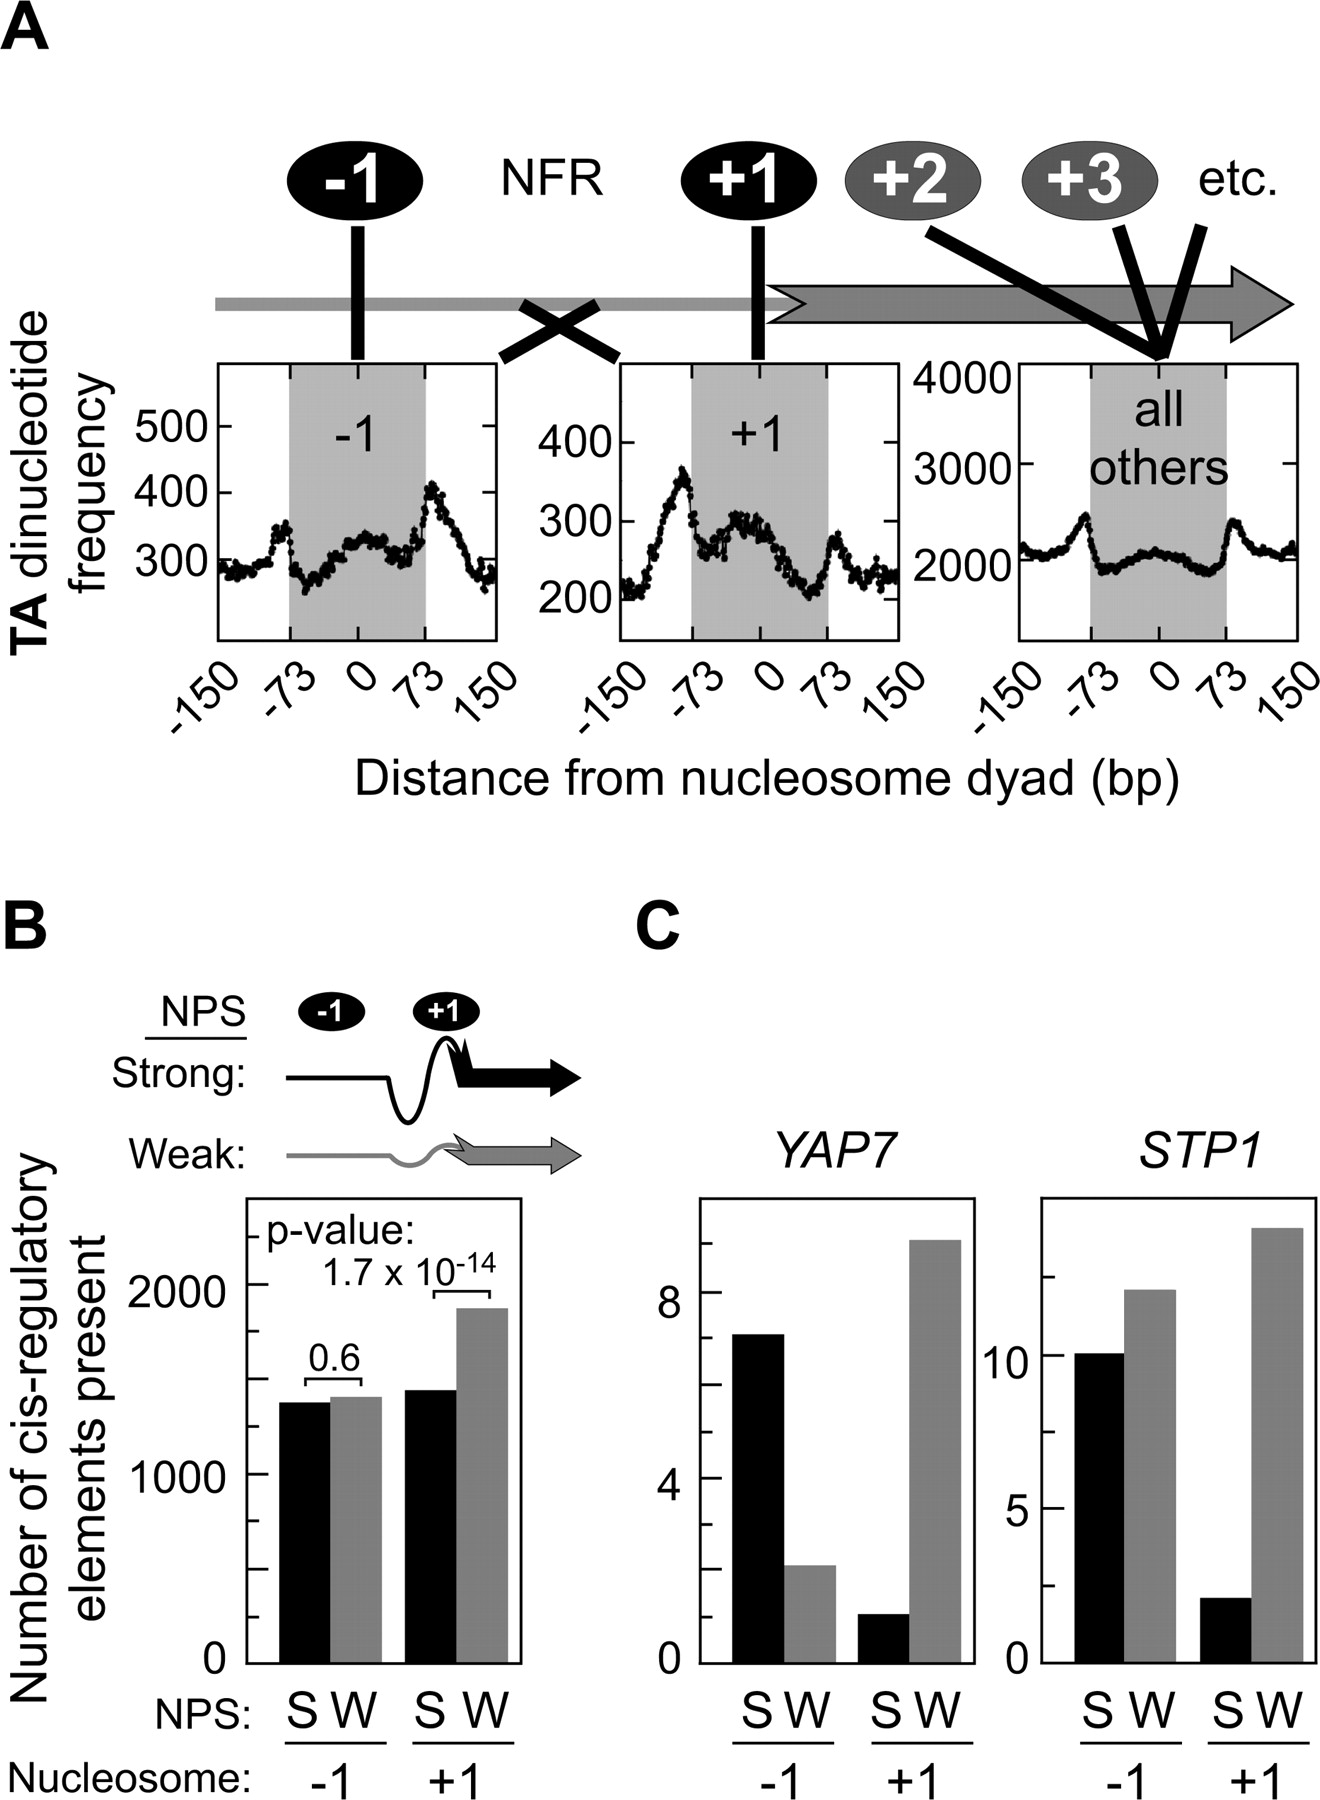
Dinucleotides and cis-regulatory elements linked to nucleosome positioning. (A) “TA” dinucleotide distribution across three classes of nucleosomal DNA. From left to right: plots are for −1, +1, and all other genic nucleosomes. To maintain directionality relative to the TSS, only the transcribed strand was compiled. This and the remaining dinucleotide plots are presented in Supplemental Fig. S8. The Y-axis is scaled such that the ratio of the upper and lower range are the same in all plots, allowing them to be compared directly. (B) Enrichment of cis-regulatory elements at +1 nucleosomes having low NPS scores. See Methods for definition of strong (S) and weak (W) NPS scores. (C) Examples of cis-regulatory elements that are enriched at +1 nucleosomes having weak NPS scores.


