
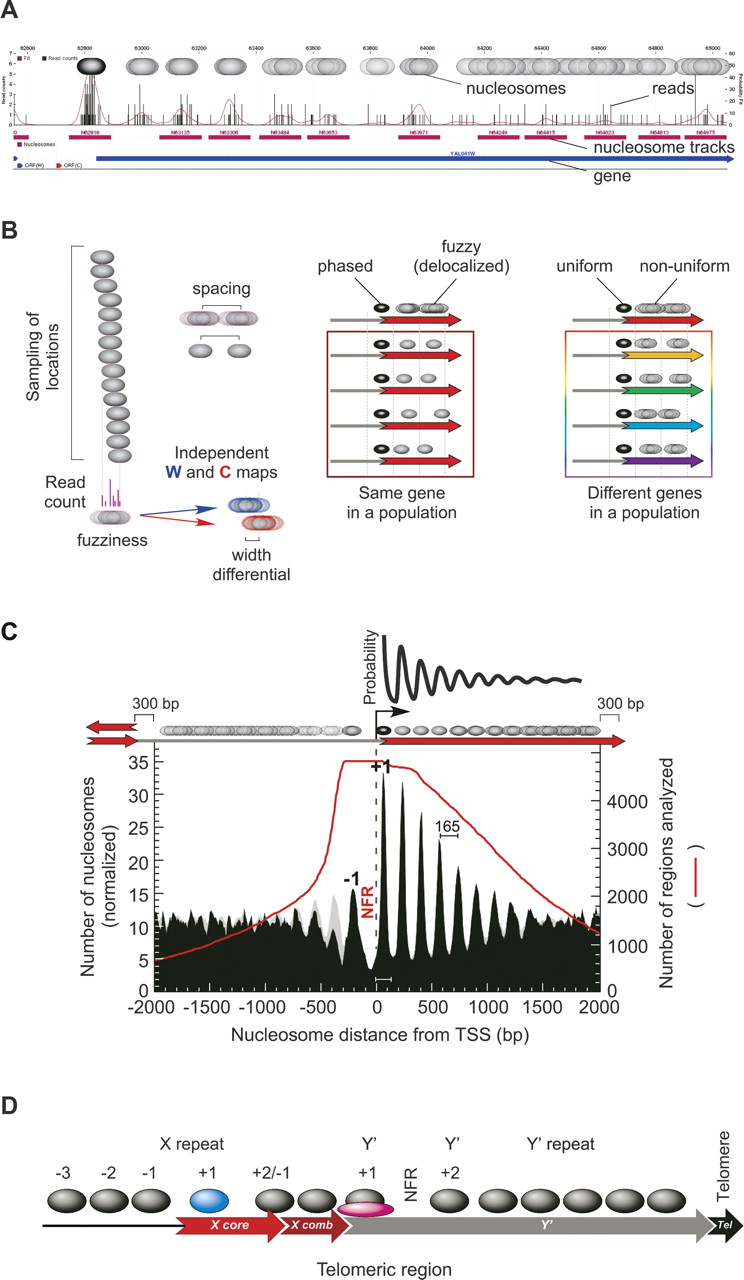
Nucleosome organization around the 5′ end of genes. (A) Browser shot showing the distribution of sequencing reads along 2.5 kb of an arbitrary gene (5′ end of YAL041W shown in blue). The read count at each coordinate is shown as a bar graph. The distribution was smoothed using a correction factor for MNase bias. Peaks correspond to assigned nucleosome locations based upon a user-defined threshold (purple tracks). Nucleosomes that are found in broad peaks or plateaus are assigned a specific location, although their actual position is delocalized (illustrated by overlapping ovals). Additional browser shots are shown in Supplemental Figure S3 and for any queried locus at http://atlas.bx.psu.edu/. (B) Illustration of the physical properties associated with nucleosome positions, which are defined in Table 1. (C) Distribution of nucleosome locations relative to transcriptional start sites (TSS) (David et al. 2006). Nucleosome distances were binned and the count divided by 100, then normalized to the number of regions (red line) present in each bin, and plotted as a smoothed distribution (black-filled plot). In an effort to represent a “pure” pattern, regions <300 bp from an adjacent TSS or TTS (transcript termination site) but also >300 bp from the reference TSS, were removed from the analysis. The same plot was generated without these filters (gray-filled plot, in background). An illustration of the statistical distribution of nucleosomes reported by Kornberg and Stryer (1988) is shown at the top of the panel. (D) Schematic illustration of nucleosome organization at telomeric regions. The arrangement of repeat elements is not representative of all telomeres, but represents a common arrangement. Positions of nucleosomes are approximate and reflect general themes, such as nucleosome-free zones, and noteworthy nucleosomes (colored blue, or bound by another protein in pink).


