
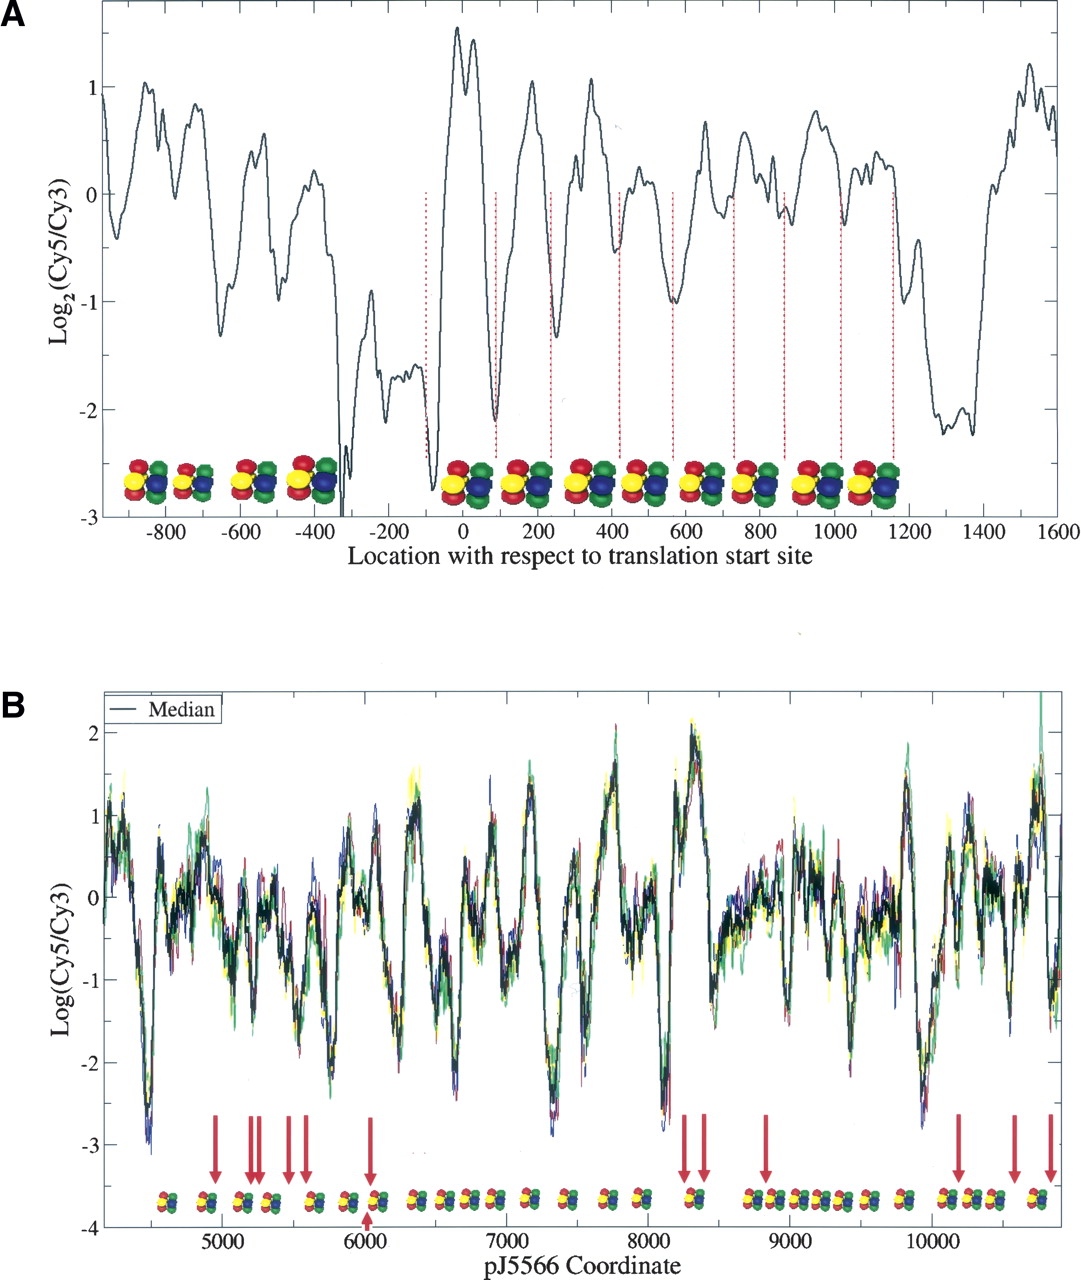
Chromatin structure of (A) ade6 and (B) cnt2. The mono-nucleosome band in Figure 1B was extracted, labeled with Cy5 dye, and hybridized onto the microarray, with MNase-digested naked DNA of similar size labeled with Cy3 as control. (A, black line) The mean of nucleosome data from four biological replicate experiments. (Red dotted lines) The MNase cleavage sites of eight previously known positioned nucleosomes (Bernardi et al. 1991). Positioned nucleosomes detected by our method are shown as histone octamers and agree very well with Bernardi et al. (1991). (B) The median nucleosome signal of three biological replicates, each with (bold black) two technical replicates; (colored lines) individual replicates. The technical replicates come from tiling both strands of cnt2. Positioned nucleosomes based on the median signal are shown as histone octomers. (Red arrows, including the one below pointing upward) The GATA motifs in troughs that are potential Ams2-binding sites.


