
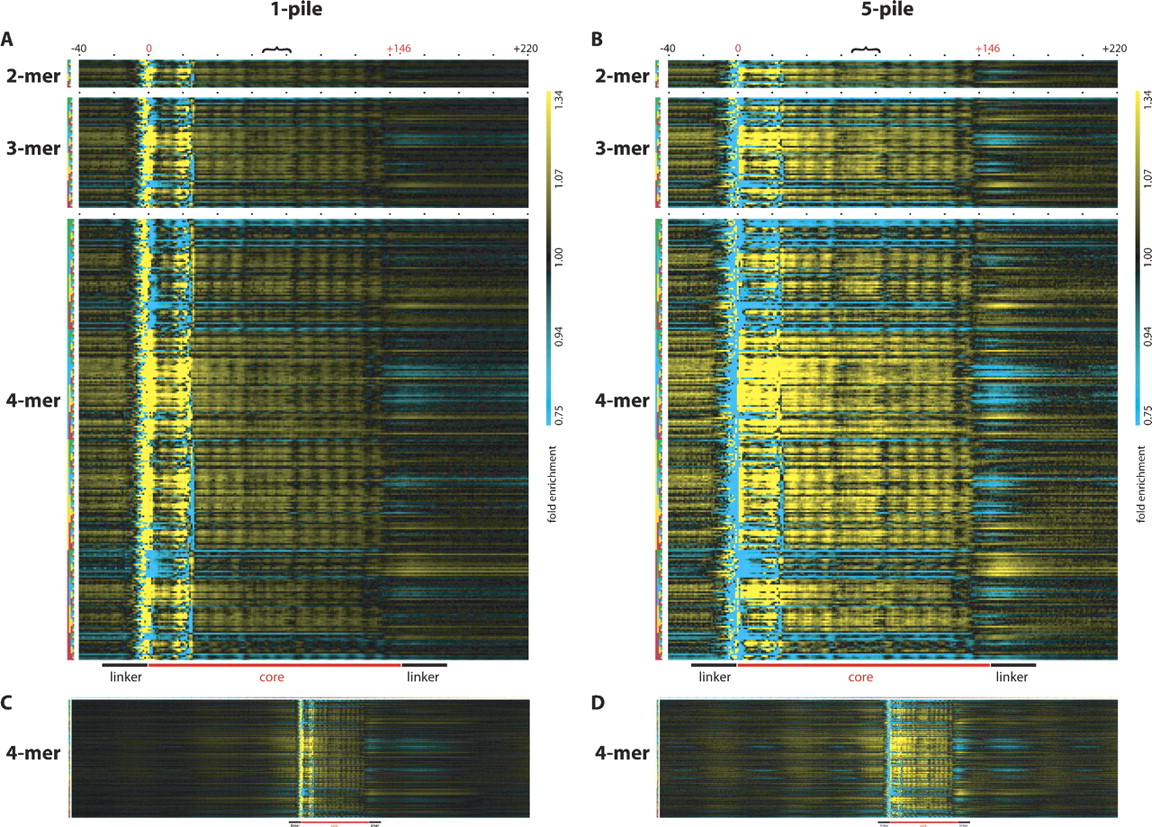
Over- and under-representation of oligonucleotide words in and around nucleosome cores. The over- (yellow) and under-representation (cyan) of k-mer words in the nucleosome core is displayed for every position within the core. Each column represents the position in or around the nucleosome core starting with the position 40 nt upstream and ending with the position 220 nt downstream of the start position of the core as indicated by the black numbers −40 and +220. The putative start and end positions of the core are indicated with the red numbers 0 and +146, respectively, and black dots demark positions 20 nt apart, and the black bracket indicates the position of the putative nucleosome dyad. Each row represents one of the 16 possible 2-mers, 64 possible 3-mers, and 256 possible 4-mers, with the k-mer key to the left representing A in green, C in blue, G in yellow, and T in red. Thus, the key for the first row indicates AA as two green boxes, the second row indicates AC as a green, and then a blue box, the third row indicates AG as a green and then a yellow box, the fourth row indicates AT as a green and then a red box, etc. The over- or under-representation of each dinucleotide may be assessed at any position in or around the nucleosome core by looking at the intersection of any column (position relative to the start of the nucleosome core) and any row (individual dinucleotide word) with the color indicating over- (yellow) or under-representation (cyan) relative to the control value (black indicating no enrichment over sequenced control DNA). (A,B) The same depiction of data derived from the 1-pile or 5-pile data sets, respectively. (C,D) The same 4-mer analysis as in A and B expanded to show 500 positions both upstream and downstream of the nucleosome core start site. The magnification in C and D is reduced to allow visualization of all the positions. In all panels, the fold enrichment scale is the same ranging from 0.75- to 1.34-fold enrichment, and the color range is shown to the far right of A and B. Additionally, a cartoon depiction of the position of the nucleosome core along with the linker region relative to the graphical data is displayed at the bottom of A and B and at the bottom of C and D, scaled for panels. In all panels, sequencing and enzymatic biases affect the representation of k-mer words between positions −10 and +25, while the rest of the plot is expected to be free of these biases.


